Note
Go to the end to download the full example code.
A simple Darcy-Flow dataset
An introduction to the small Darcy-Flow example dataset we ship with the package.
The Darcy-Flow problem is a fundamental partial differential equation (PDE) in fluid mechanics that describes the flow of a fluid through a porous medium. In this tutorial, we explore the dataset structure and visualize how the data is processed for neural operator training.
Import the library
We first import our neuralop library and required dependencies.
import matplotlib.pyplot as plt
from neuralop.data.datasets import load_darcy_flow_small
from neuralop.layers.embeddings import GridEmbedding2D
Load the dataset
Training samples are 16x16 and we load testing samples at both 16x16 and 32x32 (to test resolution invariance).
train_loader, test_loaders, data_processor = load_darcy_flow_small(
    n_train=20,
    batch_size=4,
    test_resolutions=[16, 32],
    n_tests=[10, 10],
    test_batch_sizes=[4, 2],
)

train_dataset = train_loader.dataset
Download in progress: 0.02%
Download in progress: 0.03%
Download in progress: 0.05%
Download in progress: 0.07%
Download in progress: 0.09%
Download in progress: 0.10%
Download in progress: 0.12%
Download in progress: 0.14%
Download in progress: 0.16%
Download in progress: 0.17%
Download in progress: 0.19%
Download in progress: 0.21%
Download in progress: 0.23%
Download in progress: 0.24%
Download in progress: 0.26%
Download in progress: 0.28%
Download in progress: 0.30%
Download in progress: 0.31%
Download in progress: 0.33%
Download in progress: 0.35%
Download in progress: 0.37%
Download in progress: 0.38%
Download in progress: 0.40%
Download in progress: 0.42%
Download in progress: 0.44%
Download in progress: 0.45%
Download in progress: 0.47%
Download in progress: 0.49%
Download in progress: 0.51%
Download in progress: 0.52%
Download in progress: 0.54%
Download in progress: 0.56%
Download in progress: 0.58%
Download in progress: 0.59%
Download in progress: 0.61%
Download in progress: 0.63%
Download in progress: 0.65%
Download in progress: 0.66%
Download in progress: 0.68%
Download in progress: 0.70%
Download in progress: 0.72%
Download in progress: 0.73%
Download in progress: 0.75%
Download in progress: 0.77%
Download in progress: 0.79%
Download in progress: 0.80%
Download in progress: 0.82%
Download in progress: 0.84%
Download in progress: 0.86%
Download in progress: 0.87%
Download in progress: 0.89%
Download in progress: 0.91%
Download in progress: 0.93%
Download in progress: 0.94%
Download in progress: 0.96%
Download in progress: 0.98%
Download in progress: 1.00%
Download in progress: 1.01%
Download in progress: 1.03%
Download in progress: 1.05%
Download in progress: 1.07%
Download in progress: 1.08%
Download in progress: 1.10%
Download in progress: 1.12%
Download in progress: 1.14%
Download in progress: 1.15%
Download in progress: 1.17%
Download in progress: 1.19%
Download in progress: 1.21%
Download in progress: 1.22%
Download in progress: 1.24%
Download in progress: 1.26%
Download in progress: 1.28%
Download in progress: 1.29%
Download in progress: 1.31%
Download in progress: 1.33%
Download in progress: 1.35%
Download in progress: 1.36%
Download in progress: 1.38%
Download in progress: 1.40%
Download in progress: 1.42%
Download in progress: 1.43%
Download in progress: 1.45%
Download in progress: 1.47%
Download in progress: 1.49%
Download in progress: 1.50%
Download in progress: 1.52%
Download in progress: 1.54%
Download in progress: 1.56%
Download in progress: 1.57%
Download in progress: 1.59%
Download in progress: 1.61%
Download in progress: 1.63%
Download in progress: 1.64%
Download in progress: 1.66%
Download in progress: 1.68%
Download in progress: 1.70%
Download in progress: 1.71%
Download in progress: 1.73%
Download in progress: 1.75%
Download in progress: 1.77%
Download in progress: 1.78%
Download in progress: 1.80%
Download in progress: 1.82%
Download in progress: 1.84%
Download in progress: 1.85%
Download in progress: 1.87%
Download in progress: 1.89%
Download in progress: 1.91%
Download in progress: 1.92%
Download in progress: 1.94%
Download in progress: 1.96%
Download in progress: 1.98%
Download in progress: 1.99%
Download in progress: 2.01%
Download in progress: 2.03%
Download in progress: 2.05%
Download in progress: 2.06%
Download in progress: 2.08%
Download in progress: 2.10%
Download in progress: 2.12%
Download in progress: 2.13%
Download in progress: 2.15%
Download in progress: 2.17%
Download in progress: 2.19%
Download in progress: 2.20%
Download in progress: 2.22%
Download in progress: 2.24%
Download in progress: 2.26%
Download in progress: 2.27%
Download in progress: 2.29%
Download in progress: 2.31%
Download in progress: 2.33%
Download in progress: 2.34%
Download in progress: 2.36%
Download in progress: 2.38%
Download in progress: 2.39%
Download in progress: 2.41%
Download in progress: 2.43%
Download in progress: 2.45%
Download in progress: 2.46%
Download in progress: 2.48%
Download in progress: 2.50%
Download in progress: 2.52%
Download in progress: 2.53%
Download in progress: 2.55%
Download in progress: 2.57%
Download in progress: 2.59%
Download in progress: 2.60%
Download in progress: 2.62%
Download in progress: 2.64%
Download in progress: 2.66%
Download in progress: 2.67%
Download in progress: 2.69%
Download in progress: 2.71%
Download in progress: 2.73%
Download in progress: 2.74%
Download in progress: 2.76%
Download in progress: 2.78%
Download in progress: 2.80%
Download in progress: 2.81%
Download in progress: 2.83%
Download in progress: 2.85%
Download in progress: 2.87%
Download in progress: 2.88%
Download in progress: 2.90%
Download in progress: 2.92%
Download in progress: 2.94%
Download in progress: 2.95%
Download in progress: 2.97%
Download in progress: 2.99%
Download in progress: 3.01%
Download in progress: 3.02%
Download in progress: 3.04%
Download in progress: 3.06%
Download in progress: 3.08%
Download in progress: 3.09%
Download in progress: 3.11%
Download in progress: 3.13%
Download in progress: 3.15%
Download in progress: 3.16%
Download in progress: 3.18%
Download in progress: 3.20%
Download in progress: 3.22%
Download in progress: 3.23%
Download in progress: 3.25%
Download in progress: 3.27%
Download in progress: 3.29%
Download in progress: 3.30%
Download in progress: 3.32%
Download in progress: 3.34%
Download in progress: 3.36%
Download in progress: 3.37%
Download in progress: 3.39%
Download in progress: 3.41%
Download in progress: 3.43%
Download in progress: 3.44%
Download in progress: 3.46%
Download in progress: 3.48%
Download in progress: 3.50%
Download in progress: 3.51%
Download in progress: 3.53%
Download in progress: 3.55%
Download in progress: 3.57%
Download in progress: 3.58%
Download in progress: 3.60%
Download in progress: 3.62%
Download in progress: 3.64%
Download in progress: 3.65%
Download in progress: 3.67%
Download in progress: 3.69%
Download in progress: 3.71%
Download in progress: 3.72%
Download in progress: 3.74%
Download in progress: 3.76%
Download in progress: 3.78%
Download in progress: 3.79%
Download in progress: 3.81%
Download in progress: 3.83%
Download in progress: 3.85%
Download in progress: 3.86%
Download in progress: 3.88%
Download in progress: 3.90%
Download in progress: 3.92%
Download in progress: 3.93%
Download in progress: 3.95%
Download in progress: 3.97%
Download in progress: 3.99%
Download in progress: 4.00%
Download in progress: 4.02%
Download in progress: 4.04%
Download in progress: 4.06%
Download in progress: 4.07%
Download in progress: 4.09%
Download in progress: 4.11%
Download in progress: 4.13%
Download in progress: 4.14%
Download in progress: 4.16%
Download in progress: 4.18%
Download in progress: 4.20%
Download in progress: 4.21%
Download in progress: 4.23%
Download in progress: 4.25%
Download in progress: 4.27%
Download in progress: 4.28%
Download in progress: 4.30%
Download in progress: 4.32%
Download in progress: 4.34%
Download in progress: 4.35%
Download in progress: 4.37%
Download in progress: 4.39%
Download in progress: 4.41%
Download in progress: 4.42%
Download in progress: 4.44%
Download in progress: 4.46%
Download in progress: 4.48%
Download in progress: 4.49%
Download in progress: 4.51%
Download in progress: 4.53%
Download in progress: 4.55%
Download in progress: 4.56%
Download in progress: 4.58%
Download in progress: 4.60%
Download in progress: 4.62%
Download in progress: 4.63%
Download in progress: 4.65%
Download in progress: 4.67%
Download in progress: 4.69%
Download in progress: 4.70%
Download in progress: 4.72%
Download in progress: 4.74%
Download in progress: 4.75%
Download in progress: 4.77%
Download in progress: 4.79%
Download in progress: 4.81%
Download in progress: 4.82%
Download in progress: 4.84%
Download in progress: 4.86%
Download in progress: 4.88%
Download in progress: 4.89%
Download in progress: 4.91%
Download in progress: 4.93%
Download in progress: 4.95%
Download in progress: 4.96%
Download in progress: 4.98%
Download in progress: 5.00%
Download in progress: 5.02%
Download in progress: 5.03%
Download in progress: 5.05%
Download in progress: 5.07%
Download in progress: 5.09%
Download in progress: 5.10%
Download in progress: 5.12%
Download in progress: 5.14%
Download in progress: 5.16%
Download in progress: 5.17%
Download in progress: 5.19%
Download in progress: 5.21%
Download in progress: 5.23%
Download in progress: 5.24%
Download in progress: 5.26%
Download in progress: 5.28%
Download in progress: 5.30%
Download in progress: 5.31%
Download in progress: 5.33%
Download in progress: 5.35%
Download in progress: 5.37%
Download in progress: 5.38%
Download in progress: 5.40%
Download in progress: 5.42%
Download in progress: 5.44%
Download in progress: 5.45%
Download in progress: 5.47%
Download in progress: 5.49%
Download in progress: 5.51%
Download in progress: 5.52%
Download in progress: 5.54%
Download in progress: 5.56%
Download in progress: 5.58%
Download in progress: 5.59%
Download in progress: 5.61%
Download in progress: 5.63%
Download in progress: 5.65%
Download in progress: 5.66%
Download in progress: 5.68%
Download in progress: 5.70%
Download in progress: 5.72%
Download in progress: 5.73%
Download in progress: 5.75%
Download in progress: 5.77%
Download in progress: 5.79%
Download in progress: 5.80%
Download in progress: 5.82%
Download in progress: 5.84%
Download in progress: 5.86%
Download in progress: 5.87%
Download in progress: 5.89%
Download in progress: 5.91%
Download in progress: 5.93%
Download in progress: 5.94%
Download in progress: 5.96%
Download in progress: 5.98%
Download in progress: 6.00%
Download in progress: 6.01%
Download in progress: 6.03%
Download in progress: 6.05%
Download in progress: 6.07%
Download in progress: 6.08%
Download in progress: 6.10%
Download in progress: 6.12%
Download in progress: 6.14%
Download in progress: 6.15%
Download in progress: 6.17%
Download in progress: 6.19%
Download in progress: 6.21%
Download in progress: 6.22%
Download in progress: 6.24%
Download in progress: 6.26%
Download in progress: 6.28%
Download in progress: 6.29%
Download in progress: 6.31%
Download in progress: 6.33%
Download in progress: 6.35%
Download in progress: 6.36%
Download in progress: 6.38%
Download in progress: 6.40%
Download in progress: 6.42%
Download in progress: 6.43%
Download in progress: 6.45%
Download in progress: 6.47%
Download in progress: 6.49%
Download in progress: 6.50%
Download in progress: 6.52%
Download in progress: 6.54%
Download in progress: 6.56%
Download in progress: 6.57%
Download in progress: 6.59%
Download in progress: 6.61%
Download in progress: 6.63%
Download in progress: 6.64%
Download in progress: 6.66%
Download in progress: 6.68%
Download in progress: 6.70%
Download in progress: 6.71%
Download in progress: 6.73%
Download in progress: 6.75%
Download in progress: 6.77%
Download in progress: 6.78%
Download in progress: 6.80%
Download in progress: 6.82%
Download in progress: 6.84%
Download in progress: 6.85%
Download in progress: 6.87%
Download in progress: 6.89%
Download in progress: 6.91%
Download in progress: 6.92%
Download in progress: 6.94%
Download in progress: 6.96%
Download in progress: 6.98%
Download in progress: 6.99%
Download in progress: 7.01%
Download in progress: 7.03%
Download in progress: 7.05%
Download in progress: 7.06%
Download in progress: 7.08%
Download in progress: 7.10%
Download in progress: 7.11%
Download in progress: 7.13%
Download in progress: 7.15%
Download in progress: 7.17%
Download in progress: 7.18%
Download in progress: 7.20%
Download in progress: 7.22%
Download in progress: 7.24%
Download in progress: 7.25%
Download in progress: 7.27%
Download in progress: 7.29%
Download in progress: 7.31%
Download in progress: 7.32%
Download in progress: 7.34%
Download in progress: 7.36%
Download in progress: 7.38%
Download in progress: 7.39%
Download in progress: 7.41%
Download in progress: 7.43%
Download in progress: 7.45%
Download in progress: 7.46%
Download in progress: 7.48%
Download in progress: 7.50%
Download in progress: 7.52%
Download in progress: 7.53%
Download in progress: 7.55%
Download in progress: 7.57%
Download in progress: 7.59%
Download in progress: 7.60%
Download in progress: 7.62%
Download in progress: 7.64%
Download in progress: 7.66%
Download in progress: 7.67%
Download in progress: 7.69%
Download in progress: 7.71%
Download in progress: 7.73%
Download in progress: 7.74%
Download in progress: 7.76%
Download in progress: 7.78%
Download in progress: 7.80%
Download in progress: 7.81%
Download in progress: 7.83%
Download in progress: 7.85%
Download in progress: 7.87%
Download in progress: 7.88%
Download in progress: 7.90%
Download in progress: 7.92%
Download in progress: 7.94%
Download in progress: 7.95%
Download in progress: 7.97%
Download in progress: 7.99%
Download in progress: 8.01%
Download in progress: 8.02%
Download in progress: 8.04%
Download in progress: 8.06%
Download in progress: 8.08%
Download in progress: 8.09%
Download in progress: 8.11%
Download in progress: 8.13%
Download in progress: 8.15%
Download in progress: 8.16%
Download in progress: 8.18%
Download in progress: 8.20%
Download in progress: 8.22%
Download in progress: 8.23%
Download in progress: 8.25%
Download in progress: 8.27%
Download in progress: 8.29%
Download in progress: 8.30%
Download in progress: 8.32%
Download in progress: 8.34%
Download in progress: 8.36%
Download in progress: 8.37%
Download in progress: 8.39%
Download in progress: 8.41%
Download in progress: 8.43%
Download in progress: 8.44%
Download in progress: 8.46%
Download in progress: 8.48%
Download in progress: 8.50%
Download in progress: 8.51%
Download in progress: 8.53%
Download in progress: 8.55%
Download in progress: 8.57%
Download in progress: 8.58%
Download in progress: 8.60%
Download in progress: 8.62%
Download in progress: 8.64%
Download in progress: 8.65%
Download in progress: 8.67%
Download in progress: 8.69%
Download in progress: 8.71%
Download in progress: 8.72%
Download in progress: 8.74%
Download in progress: 8.76%
Download in progress: 8.78%
Download in progress: 8.79%
Download in progress: 8.81%
Download in progress: 8.83%
Download in progress: 8.85%
Download in progress: 8.86%
Download in progress: 8.88%
Download in progress: 8.90%
Download in progress: 8.92%
Download in progress: 8.93%
Download in progress: 8.95%
Download in progress: 8.97%
Download in progress: 8.99%
Download in progress: 9.00%
Download in progress: 9.02%
Download in progress: 9.04%
Download in progress: 9.06%
Download in progress: 9.07%
Download in progress: 9.09%
Download in progress: 9.11%
Download in progress: 9.13%
Download in progress: 9.14%
Download in progress: 9.16%
Download in progress: 9.18%
Download in progress: 9.20%
Download in progress: 9.21%
Download in progress: 9.23%
Download in progress: 9.25%
Download in progress: 9.27%
Download in progress: 9.28%
Download in progress: 9.30%
Download in progress: 9.32%
Download in progress: 9.34%
Download in progress: 9.35%
Download in progress: 9.37%
Download in progress: 9.39%
Download in progress: 9.41%
Download in progress: 9.42%
Download in progress: 9.44%
Download in progress: 9.46%
Download in progress: 9.47%
Download in progress: 9.49%
Download in progress: 9.51%
Download in progress: 9.53%
Download in progress: 9.54%
Download in progress: 9.56%
Download in progress: 9.58%
Download in progress: 9.60%
Download in progress: 9.61%
Download in progress: 9.63%
Download in progress: 9.65%
Download in progress: 9.67%
Download in progress: 9.68%
Download in progress: 9.70%
Download in progress: 9.72%
Download in progress: 9.74%
Download in progress: 9.75%
Download in progress: 9.77%
Download in progress: 9.79%
Download in progress: 9.81%
Download in progress: 9.82%
Download in progress: 9.84%
Download in progress: 9.86%
Download in progress: 9.88%
Download in progress: 9.89%
Download in progress: 9.91%
Download in progress: 9.93%
Download in progress: 9.95%
Download in progress: 9.96%
Download in progress: 9.98%
Download in progress: 10.00%
Download in progress: 10.02%
Download in progress: 10.03%
Download in progress: 10.05%
Download in progress: 10.07%
Download in progress: 10.09%
Download in progress: 10.10%
Download in progress: 10.12%
Download in progress: 10.14%
Download in progress: 10.16%
Download in progress: 10.17%
Download in progress: 10.19%
Download in progress: 10.21%
Download in progress: 10.23%
Download in progress: 10.24%
Download in progress: 10.26%
Download in progress: 10.28%
Download in progress: 10.30%
Download in progress: 10.31%
Download in progress: 10.33%
Download in progress: 10.35%
Download in progress: 10.37%
Download in progress: 10.38%
Download in progress: 10.40%
Download in progress: 10.42%
Download in progress: 10.44%
Download in progress: 10.45%
Download in progress: 10.47%
Download in progress: 10.49%
Download in progress: 10.51%
Download in progress: 10.52%
Download in progress: 10.54%
Download in progress: 10.56%
Download in progress: 10.58%
Download in progress: 10.59%
Download in progress: 10.61%
Download in progress: 10.63%
Download in progress: 10.65%
Download in progress: 10.66%
Download in progress: 10.68%
Download in progress: 10.70%
Download in progress: 10.72%
Download in progress: 10.73%
Download in progress: 10.75%
Download in progress: 10.77%
Download in progress: 10.79%
Download in progress: 10.80%
Download in progress: 10.82%
Download in progress: 10.84%
Download in progress: 10.86%
Download in progress: 10.87%
Download in progress: 10.89%
Download in progress: 10.91%
Download in progress: 10.93%
Download in progress: 10.94%
Download in progress: 10.96%
Download in progress: 10.98%
Download in progress: 11.00%
Download in progress: 11.01%
Download in progress: 11.03%
Download in progress: 11.05%
Download in progress: 11.07%
Download in progress: 11.08%
Download in progress: 11.10%
Download in progress: 11.12%
Download in progress: 11.14%
Download in progress: 11.15%
Download in progress: 11.17%
Download in progress: 11.19%
Download in progress: 11.21%
Download in progress: 11.22%
Download in progress: 11.24%
Download in progress: 11.26%
Download in progress: 11.28%
Download in progress: 11.29%
Download in progress: 11.31%
Download in progress: 11.33%
Download in progress: 11.35%
Download in progress: 11.36%
Download in progress: 11.38%
Download in progress: 11.40%
Download in progress: 11.42%
Download in progress: 11.43%
Download in progress: 11.45%
Download in progress: 11.47%
Download in progress: 11.49%
Download in progress: 11.50%
Download in progress: 11.52%
Download in progress: 11.54%
Download in progress: 11.56%
Download in progress: 11.57%
Download in progress: 11.59%
Download in progress: 11.61%
Download in progress: 11.63%
Download in progress: 11.64%
Download in progress: 11.66%
Download in progress: 11.68%
Download in progress: 11.70%
Download in progress: 11.71%
Download in progress: 11.73%
Download in progress: 11.75%
Download in progress: 11.77%
Download in progress: 11.78%
Download in progress: 11.80%
Download in progress: 11.82%
Download in progress: 11.83%
Download in progress: 11.85%
Download in progress: 11.87%
Download in progress: 11.89%
Download in progress: 11.90%
Download in progress: 11.92%
Download in progress: 11.94%
Download in progress: 11.96%
Download in progress: 11.97%
Download in progress: 11.99%
Download in progress: 12.01%
Download in progress: 12.03%
Download in progress: 12.04%
Download in progress: 12.06%
Download in progress: 12.08%
Download in progress: 12.10%
Download in progress: 12.11%
Download in progress: 12.13%
Download in progress: 12.15%
Download in progress: 12.17%
Download in progress: 12.18%
Download in progress: 12.20%
Download in progress: 12.22%
Download in progress: 12.24%
Download in progress: 12.25%
Download in progress: 12.27%
Download in progress: 12.29%
Download in progress: 12.31%
Download in progress: 12.32%
Download in progress: 12.34%
Download in progress: 12.36%
Download in progress: 12.38%
Download in progress: 12.39%
Download in progress: 12.41%
Download in progress: 12.43%
Download in progress: 12.45%
Download in progress: 12.46%
Download in progress: 12.48%
Download in progress: 12.50%
Download in progress: 12.52%
Download in progress: 12.53%
Download in progress: 12.55%
Download in progress: 12.57%
Download in progress: 12.59%
Download in progress: 12.60%
Download in progress: 12.62%
Download in progress: 12.64%
Download in progress: 12.66%
Download in progress: 12.67%
Download in progress: 12.69%
Download in progress: 12.71%
Download in progress: 12.73%
Download in progress: 12.74%
Download in progress: 12.76%
Download in progress: 12.78%
Download in progress: 12.80%
Download in progress: 12.81%
Download in progress: 12.83%
Download in progress: 12.85%
Download in progress: 12.87%
Download in progress: 12.88%
Download in progress: 12.90%
Download in progress: 12.92%
Download in progress: 12.94%
Download in progress: 12.95%
Download in progress: 12.97%
Download in progress: 12.99%
Download in progress: 13.01%
Download in progress: 13.02%
Download in progress: 13.04%
Download in progress: 13.06%
Download in progress: 13.08%
Download in progress: 13.09%
Download in progress: 13.11%
Download in progress: 13.13%
Download in progress: 13.15%
Download in progress: 13.16%
Download in progress: 13.18%
Download in progress: 13.20%
Download in progress: 13.22%
Download in progress: 13.23%
Download in progress: 13.25%
Download in progress: 13.27%
Download in progress: 13.29%
Download in progress: 13.30%
Download in progress: 13.32%
Download in progress: 13.34%
Download in progress: 13.36%
Download in progress: 13.37%
Download in progress: 13.39%
Download in progress: 13.41%
Download in progress: 13.43%
Download in progress: 13.44%
Download in progress: 13.46%
Download in progress: 13.48%
Download in progress: 13.50%
Download in progress: 13.51%
Download in progress: 13.53%
Download in progress: 13.55%
Download in progress: 13.57%
Download in progress: 13.58%
Download in progress: 13.60%
Download in progress: 13.62%
Download in progress: 13.64%
Download in progress: 13.65%
Download in progress: 13.67%
Download in progress: 13.69%
Download in progress: 13.71%
Download in progress: 13.72%
Download in progress: 13.74%
Download in progress: 13.76%
Download in progress: 13.78%
Download in progress: 13.79%
Download in progress: 13.81%
Download in progress: 13.83%
Download in progress: 13.85%
Download in progress: 13.86%
Download in progress: 13.88%
Download in progress: 13.90%
Download in progress: 13.92%
Download in progress: 13.93%
Download in progress: 13.95%
Download in progress: 13.97%
Download in progress: 13.99%
Download in progress: 14.00%
Download in progress: 14.02%
Download in progress: 14.04%
Download in progress: 14.06%
Download in progress: 14.07%
Download in progress: 14.09%
Download in progress: 14.11%
Download in progress: 14.13%
Download in progress: 14.14%
Download in progress: 14.16%
Download in progress: 14.18%
Download in progress: 14.20%
Download in progress: 14.21%
Download in progress: 14.23%
Download in progress: 14.25%
Download in progress: 14.26%
Download in progress: 14.28%
Download in progress: 14.30%
Download in progress: 14.32%
Download in progress: 14.33%
Download in progress: 14.35%
Download in progress: 14.37%
Download in progress: 14.39%
Download in progress: 14.40%
Download in progress: 14.42%
Download in progress: 14.44%
Download in progress: 14.46%
Download in progress: 14.47%
Download in progress: 14.49%
Download in progress: 14.51%
Download in progress: 14.53%
Download in progress: 14.54%
Download in progress: 14.56%
Download in progress: 14.58%
Download in progress: 14.60%
Download in progress: 14.61%
Download in progress: 14.63%
Download in progress: 14.65%
Download in progress: 14.67%
Download in progress: 14.68%
Download in progress: 14.70%
Download in progress: 14.72%
Download in progress: 14.74%
Download in progress: 14.75%
Download in progress: 14.77%
Download in progress: 14.79%
Download in progress: 14.81%
Download in progress: 14.82%
Download in progress: 14.84%
Download in progress: 14.86%
Download in progress: 14.88%
Download in progress: 14.89%
Download in progress: 14.91%
Download in progress: 14.93%
Download in progress: 14.95%
Download in progress: 14.96%
Download in progress: 14.98%
Download in progress: 15.00%
Download in progress: 15.02%
Download in progress: 15.03%
Download in progress: 15.05%
Download in progress: 15.07%
Download in progress: 15.09%
Download in progress: 15.10%
Download in progress: 15.12%
Download in progress: 15.14%
Download in progress: 15.16%
Download in progress: 15.17%
Download in progress: 15.19%
Download in progress: 15.21%
Download in progress: 15.23%
Download in progress: 15.24%
Download in progress: 15.26%
Download in progress: 15.28%
Download in progress: 15.30%
Download in progress: 15.31%
Download in progress: 15.33%
Download in progress: 15.35%
Download in progress: 15.37%
Download in progress: 15.38%
Download in progress: 15.40%
Download in progress: 15.42%
Download in progress: 15.44%
Download in progress: 15.45%
Download in progress: 15.47%
Download in progress: 15.49%
Download in progress: 15.51%
Download in progress: 15.52%
Download in progress: 15.54%
Download in progress: 15.56%
Download in progress: 15.58%
Download in progress: 15.59%
Download in progress: 15.61%
Download in progress: 15.63%
Download in progress: 15.65%
Download in progress: 15.66%
Download in progress: 15.68%
Download in progress: 15.70%
Download in progress: 15.72%
Download in progress: 15.73%
Download in progress: 15.75%
Download in progress: 15.77%
Download in progress: 15.79%
Download in progress: 15.80%
Download in progress: 15.82%
Download in progress: 15.84%
Download in progress: 15.86%
Download in progress: 15.87%
Download in progress: 15.89%
Download in progress: 15.91%
Download in progress: 15.93%
Download in progress: 15.94%
Download in progress: 15.96%
Download in progress: 15.98%
Download in progress: 16.00%
Download in progress: 16.01%
Download in progress: 16.03%
Download in progress: 16.05%
Download in progress: 16.07%
Download in progress: 16.08%
Download in progress: 16.10%
Download in progress: 16.12%
Download in progress: 16.14%
Download in progress: 16.15%
Download in progress: 16.17%
Download in progress: 16.19%
Download in progress: 16.21%
Download in progress: 16.22%
Download in progress: 16.24%
Download in progress: 16.26%
Download in progress: 16.28%
Download in progress: 16.29%
Download in progress: 16.31%
Download in progress: 16.33%
Download in progress: 16.35%
Download in progress: 16.36%
Download in progress: 16.38%
Download in progress: 16.40%
Download in progress: 16.42%
Download in progress: 16.43%
Download in progress: 16.45%
Download in progress: 16.47%
Download in progress: 16.49%
Download in progress: 16.50%
Download in progress: 16.52%
Download in progress: 16.54%
Download in progress: 16.56%
Download in progress: 16.57%
Download in progress: 16.59%
Download in progress: 16.61%
Download in progress: 16.62%
Download in progress: 16.64%
Download in progress: 16.66%
Download in progress: 16.68%
Download in progress: 16.69%
Download in progress: 16.71%
Download in progress: 16.73%
Download in progress: 16.75%
Download in progress: 16.76%
Download in progress: 16.78%
Download in progress: 16.80%
Download in progress: 16.82%
Download in progress: 16.83%
Download in progress: 16.85%
Download in progress: 16.87%
Download in progress: 16.89%
Download in progress: 16.90%
Download in progress: 16.92%
Download in progress: 16.94%
Download in progress: 16.96%
Download in progress: 16.97%
Download in progress: 16.99%
Download in progress: 17.01%
Download in progress: 17.03%
Download in progress: 17.04%
Download in progress: 17.06%
Download in progress: 17.08%
Download in progress: 17.10%
Download in progress: 17.11%
Download in progress: 17.13%
Download in progress: 17.15%
Download in progress: 17.17%
Download in progress: 17.18%
Download in progress: 17.20%
Download in progress: 17.22%
Download in progress: 17.24%
Download in progress: 17.25%
Download in progress: 17.27%
Download in progress: 17.29%
Download in progress: 17.31%
Download in progress: 17.32%
Download in progress: 17.34%
Download in progress: 17.36%
Download in progress: 17.38%
Download in progress: 17.39%
Download in progress: 17.41%
Download in progress: 17.43%
Download in progress: 17.45%
Download in progress: 17.46%
Download in progress: 17.48%
Download in progress: 17.50%
Download in progress: 17.52%
Download in progress: 17.53%
Download in progress: 17.55%
Download in progress: 17.57%
Download in progress: 17.59%
Download in progress: 17.60%
Download in progress: 17.62%
Download in progress: 17.64%
Download in progress: 17.66%
Download in progress: 17.67%
Download in progress: 17.69%
Download in progress: 17.71%
Download in progress: 17.73%
Download in progress: 17.74%
Download in progress: 17.76%
Download in progress: 17.78%
Download in progress: 17.80%
Download in progress: 17.81%
Download in progress: 17.83%
Download in progress: 17.85%
Download in progress: 17.87%
Download in progress: 17.88%
Download in progress: 17.90%
Download in progress: 17.92%
Download in progress: 17.94%
Download in progress: 17.95%
Download in progress: 17.97%
Download in progress: 17.99%
Download in progress: 18.01%
Download in progress: 18.02%
Download in progress: 18.04%
Download in progress: 18.06%
Download in progress: 18.08%
Download in progress: 18.09%
Download in progress: 18.11%
Download in progress: 18.13%
Download in progress: 18.15%
Download in progress: 18.16%
Download in progress: 18.18%
Download in progress: 18.20%
Download in progress: 18.22%
Download in progress: 18.23%
Download in progress: 18.25%
Download in progress: 18.27%
Download in progress: 18.29%
Download in progress: 18.30%
Download in progress: 18.32%
Download in progress: 18.34%
Download in progress: 18.36%
Download in progress: 18.37%
Download in progress: 18.39%
Download in progress: 18.41%
Download in progress: 18.43%
Download in progress: 18.44%
Download in progress: 18.46%
Download in progress: 18.48%
Download in progress: 18.50%
Download in progress: 18.51%
Download in progress: 18.53%
Download in progress: 18.55%
Download in progress: 18.57%
Download in progress: 18.58%
Download in progress: 18.60%
Download in progress: 18.62%
Download in progress: 18.64%
Download in progress: 18.65%
Download in progress: 18.67%
Download in progress: 18.69%
Download in progress: 18.71%
Download in progress: 18.72%
Download in progress: 18.74%
Download in progress: 18.76%
Download in progress: 18.78%
Download in progress: 18.79%
Download in progress: 18.81%
Download in progress: 18.83%
Download in progress: 18.85%
Download in progress: 18.86%
Download in progress: 18.88%
Download in progress: 18.90%
Download in progress: 18.92%
Download in progress: 18.93%
Download in progress: 18.95%
Download in progress: 18.97%
Download in progress: 18.98%
Download in progress: 19.00%
Download in progress: 19.02%
Download in progress: 19.04%
Download in progress: 19.05%
Download in progress: 19.07%
Download in progress: 19.09%
Download in progress: 19.11%
Download in progress: 19.12%
Download in progress: 19.14%
Download in progress: 19.16%
Download in progress: 19.18%
Download in progress: 19.19%
Download in progress: 19.21%
Download in progress: 19.23%
Download in progress: 19.25%
Download in progress: 19.26%
Download in progress: 19.28%
Download in progress: 19.30%
Download in progress: 19.32%
Download in progress: 19.33%
Download in progress: 19.35%
Download in progress: 19.37%
Download in progress: 19.39%
Download in progress: 19.40%
Download in progress: 19.42%
Download in progress: 19.44%
Download in progress: 19.46%
Download in progress: 19.47%
Download in progress: 19.49%
Download in progress: 19.51%
Download in progress: 19.53%
Download in progress: 19.54%
Download in progress: 19.56%
Download in progress: 19.58%
Download in progress: 19.60%
Download in progress: 19.61%
Download in progress: 19.63%
Download in progress: 19.65%
Download in progress: 19.67%
Download in progress: 19.68%
Download in progress: 19.70%
Download in progress: 19.72%
Download in progress: 19.74%
Download in progress: 19.75%
Download in progress: 19.77%
Download in progress: 19.79%
Download in progress: 19.81%
Download in progress: 19.82%
Download in progress: 19.84%
Download in progress: 19.86%
Download in progress: 19.88%
Download in progress: 19.89%
Download in progress: 19.91%
Download in progress: 19.93%
Download in progress: 19.95%
Download in progress: 19.96%
Download in progress: 19.98%
Download in progress: 20.00%
Download in progress: 20.02%
Download in progress: 20.03%
Download in progress: 20.05%
Download in progress: 20.07%
Download in progress: 20.09%
Download in progress: 20.10%
Download in progress: 20.12%
Download in progress: 20.14%
Download in progress: 20.16%
Download in progress: 20.17%
Download in progress: 20.19%
Download in progress: 20.21%
Download in progress: 20.23%
Download in progress: 20.24%
Download in progress: 20.26%
Download in progress: 20.28%
Download in progress: 20.30%
Download in progress: 20.31%
Download in progress: 20.33%
Download in progress: 20.35%
Download in progress: 20.37%
Download in progress: 20.38%
Download in progress: 20.40%
Download in progress: 20.42%
Download in progress: 20.44%
Download in progress: 20.45%
Download in progress: 20.47%
Download in progress: 20.49%
Download in progress: 20.51%
Download in progress: 20.52%
Download in progress: 20.54%
Download in progress: 20.56%
Download in progress: 20.58%
Download in progress: 20.59%
Download in progress: 20.61%
Download in progress: 20.63%
Download in progress: 20.65%
Download in progress: 20.66%
Download in progress: 20.68%
Download in progress: 20.70%
Download in progress: 20.72%
Download in progress: 20.73%
Download in progress: 20.75%
Download in progress: 20.77%
Download in progress: 20.79%
Download in progress: 20.80%
Download in progress: 20.82%
Download in progress: 20.84%
Download in progress: 20.86%
Download in progress: 20.87%
Download in progress: 20.89%
Download in progress: 20.91%
Download in progress: 20.93%
Download in progress: 20.94%
Download in progress: 20.96%
Download in progress: 20.98%
Download in progress: 21.00%
Download in progress: 21.01%
Download in progress: 21.03%
Download in progress: 21.05%
Download in progress: 21.07%
Download in progress: 21.08%
Download in progress: 21.10%
Download in progress: 21.12%
Download in progress: 21.14%
Download in progress: 21.15%
Download in progress: 21.17%
Download in progress: 21.19%
Download in progress: 21.21%
Download in progress: 21.22%
Download in progress: 21.24%
Download in progress: 21.26%
Download in progress: 21.28%
Download in progress: 21.29%
Download in progress: 21.31%
Download in progress: 21.33%
Download in progress: 21.34%
Download in progress: 21.36%
Download in progress: 21.38%
Download in progress: 21.40%
Download in progress: 21.41%
Download in progress: 21.43%
Download in progress: 21.45%
Download in progress: 21.47%
Download in progress: 21.48%
Download in progress: 21.50%
Download in progress: 21.52%
Download in progress: 21.54%
Download in progress: 21.55%
Download in progress: 21.57%
Download in progress: 21.59%
Download in progress: 21.61%
Download in progress: 21.62%
Download in progress: 21.64%
Download in progress: 21.66%
Download in progress: 21.68%
Download in progress: 21.69%
Download in progress: 21.71%
Download in progress: 21.73%
Download in progress: 21.75%
Download in progress: 21.76%
Download in progress: 21.78%
Download in progress: 21.80%
Download in progress: 21.82%
Download in progress: 21.83%
Download in progress: 21.85%
Download in progress: 21.87%
Download in progress: 21.89%
Download in progress: 21.90%
Download in progress: 21.92%
Download in progress: 21.94%
Download in progress: 21.96%
Download in progress: 21.97%
Download in progress: 21.99%
Download in progress: 22.01%
Download in progress: 22.03%
Download in progress: 22.04%
Download in progress: 22.06%
Download in progress: 22.08%
Download in progress: 22.10%
Download in progress: 22.11%
Download in progress: 22.13%
Download in progress: 22.15%
Download in progress: 22.17%
Download in progress: 22.18%
Download in progress: 22.20%
Download in progress: 22.22%
Download in progress: 22.24%
Download in progress: 22.25%
Download in progress: 22.27%
Download in progress: 22.29%
Download in progress: 22.31%
Download in progress: 22.32%
Download in progress: 22.34%
Download in progress: 22.36%
Download in progress: 22.38%
Download in progress: 22.39%
Download in progress: 22.41%
Download in progress: 22.43%
Download in progress: 22.45%
Download in progress: 22.46%
Download in progress: 22.48%
Download in progress: 22.50%
Download in progress: 22.52%
Download in progress: 22.53%
Download in progress: 22.55%
Download in progress: 22.57%
Download in progress: 22.59%
Download in progress: 22.60%
Download in progress: 22.62%
Download in progress: 22.64%
Download in progress: 22.66%
Download in progress: 22.67%
Download in progress: 22.69%
Download in progress: 22.71%
Download in progress: 22.73%
Download in progress: 22.74%
Download in progress: 22.76%
Download in progress: 22.78%
Download in progress: 22.80%
Download in progress: 22.81%
Download in progress: 22.83%
Download in progress: 22.85%
Download in progress: 22.87%
Download in progress: 22.88%
Download in progress: 22.90%
Download in progress: 22.92%
Download in progress: 22.94%
Download in progress: 22.95%
Download in progress: 22.97%
Download in progress: 22.99%
Download in progress: 23.01%
Download in progress: 23.02%
Download in progress: 23.04%
Download in progress: 23.06%
Download in progress: 23.08%
Download in progress: 23.09%
Download in progress: 23.11%
Download in progress: 23.13%
Download in progress: 23.15%
Download in progress: 23.16%
Download in progress: 23.18%
Download in progress: 23.20%
Download in progress: 23.22%
Download in progress: 23.23%
Download in progress: 23.25%
Download in progress: 23.27%
Download in progress: 23.29%
Download in progress: 23.30%
Download in progress: 23.32%
Download in progress: 23.34%
Download in progress: 23.36%
Download in progress: 23.37%
Download in progress: 23.39%
Download in progress: 23.41%
Download in progress: 23.43%
Download in progress: 23.44%
Download in progress: 23.46%
Download in progress: 23.48%
Download in progress: 23.50%
Download in progress: 23.51%
Download in progress: 23.53%
Download in progress: 23.55%
Download in progress: 23.57%
Download in progress: 23.58%
Download in progress: 23.60%
Download in progress: 23.62%
Download in progress: 23.64%
Download in progress: 23.65%
Download in progress: 23.67%
Download in progress: 23.69%
Download in progress: 23.70%
Download in progress: 23.72%
Download in progress: 23.74%
Download in progress: 23.76%
Download in progress: 23.77%
Download in progress: 23.79%
Download in progress: 23.81%
Download in progress: 23.83%
Download in progress: 23.84%
Download in progress: 23.86%
Download in progress: 23.88%
Download in progress: 23.90%
Download in progress: 23.91%
Download in progress: 23.93%
Download in progress: 23.95%
Download in progress: 23.97%
Download in progress: 23.98%
Download in progress: 24.00%
Download in progress: 24.02%
Download in progress: 24.04%
Download in progress: 24.05%
Download in progress: 24.07%
Download in progress: 24.09%
Download in progress: 24.11%
Download in progress: 24.12%
Download in progress: 24.14%
Download in progress: 24.16%
Download in progress: 24.18%
Download in progress: 24.19%
Download in progress: 24.21%
Download in progress: 24.23%
Download in progress: 24.25%
Download in progress: 24.26%
Download in progress: 24.28%
Download in progress: 24.30%
Download in progress: 24.32%
Download in progress: 24.33%
Download in progress: 24.35%
Download in progress: 24.37%
Download in progress: 24.39%
Download in progress: 24.40%
Download in progress: 24.42%
Download in progress: 24.44%
Download in progress: 24.46%
Download in progress: 24.47%
Download in progress: 24.49%
Download in progress: 24.51%
Download in progress: 24.53%
Download in progress: 24.54%
Download in progress: 24.56%
Download in progress: 24.58%
Download in progress: 24.60%
Download in progress: 24.61%
Download in progress: 24.63%
Download in progress: 24.65%
Download in progress: 24.67%
Download in progress: 24.68%
Download in progress: 24.70%
Download in progress: 24.72%
Download in progress: 24.74%
Download in progress: 24.75%
Download in progress: 24.77%
Download in progress: 24.79%
Download in progress: 24.81%
Download in progress: 24.82%
Download in progress: 24.84%
Download in progress: 24.86%
Download in progress: 24.88%
Download in progress: 24.89%
Download in progress: 24.91%
Download in progress: 24.93%
Download in progress: 24.95%
Download in progress: 24.96%
Download in progress: 24.98%
Download in progress: 25.00%
Download in progress: 25.02%
Download in progress: 25.03%
Download in progress: 25.05%
Download in progress: 25.07%
Download in progress: 25.09%
Download in progress: 25.10%
Download in progress: 25.12%
Download in progress: 25.14%
Download in progress: 25.16%
Download in progress: 25.17%
Download in progress: 25.19%
Download in progress: 25.21%
Download in progress: 25.23%
Download in progress: 25.24%
Download in progress: 25.26%
Download in progress: 25.28%
Download in progress: 25.30%
Download in progress: 25.31%
Download in progress: 25.33%
Download in progress: 25.35%
Download in progress: 25.37%
Download in progress: 25.38%
Download in progress: 25.40%
Download in progress: 25.42%
Download in progress: 25.44%
Download in progress: 25.45%
Download in progress: 25.47%
Download in progress: 25.49%
Download in progress: 25.51%
Download in progress: 25.52%
Download in progress: 25.54%
Download in progress: 25.56%
Download in progress: 25.58%
Download in progress: 25.59%
Download in progress: 25.61%
Download in progress: 25.63%
Download in progress: 25.65%
Download in progress: 25.66%
Download in progress: 25.68%
Download in progress: 25.70%
Download in progress: 25.72%
Download in progress: 25.73%
Download in progress: 25.75%
Download in progress: 25.77%
Download in progress: 25.79%
Download in progress: 25.80%
Download in progress: 25.82%
Download in progress: 25.84%
Download in progress: 25.86%
Download in progress: 25.87%
Download in progress: 25.89%
Download in progress: 25.91%
Download in progress: 25.93%
Download in progress: 25.94%
Download in progress: 25.96%
Download in progress: 25.98%
Download in progress: 26.00%
Download in progress: 26.01%
Download in progress: 26.03%
Download in progress: 26.05%
Download in progress: 26.06%
Download in progress: 26.08%
Download in progress: 26.10%
Download in progress: 26.12%
Download in progress: 26.13%
Download in progress: 26.15%
Download in progress: 26.17%
Download in progress: 26.19%
Download in progress: 26.20%
Download in progress: 26.22%
Download in progress: 26.24%
Download in progress: 26.26%
Download in progress: 26.27%
Download in progress: 26.29%
Download in progress: 26.31%
Download in progress: 26.33%
Download in progress: 26.34%
Download in progress: 26.36%
Download in progress: 26.38%
Download in progress: 26.40%
Download in progress: 26.41%
Download in progress: 26.43%
Download in progress: 26.45%
Download in progress: 26.47%
Download in progress: 26.48%
Download in progress: 26.50%
Download in progress: 26.52%
Download in progress: 26.54%
Download in progress: 26.55%
Download in progress: 26.57%
Download in progress: 26.59%
Download in progress: 26.61%
Download in progress: 26.62%
Download in progress: 26.64%
Download in progress: 26.66%
Download in progress: 26.68%
Download in progress: 26.69%
Download in progress: 26.71%
Download in progress: 26.73%
Download in progress: 26.75%
Download in progress: 26.76%
Download in progress: 26.78%
Download in progress: 26.80%
Download in progress: 26.82%
Download in progress: 26.83%
Download in progress: 26.85%
Download in progress: 26.87%
Download in progress: 26.89%
Download in progress: 26.90%
Download in progress: 26.92%
Download in progress: 26.94%
Download in progress: 26.96%
Download in progress: 26.97%
Download in progress: 26.99%
Download in progress: 27.01%
Download in progress: 27.03%
Download in progress: 27.04%
Download in progress: 27.06%
Download in progress: 27.08%
Download in progress: 27.10%
Download in progress: 27.11%
Download in progress: 27.13%
Download in progress: 27.15%
Download in progress: 27.17%
Download in progress: 27.18%
Download in progress: 27.20%
Download in progress: 27.22%
Download in progress: 27.24%
Download in progress: 27.25%
Download in progress: 27.27%
Download in progress: 27.29%
Download in progress: 27.31%
Download in progress: 27.32%
Download in progress: 27.34%
Download in progress: 27.36%
Download in progress: 27.38%
Download in progress: 27.39%
Download in progress: 27.41%
Download in progress: 27.43%
Download in progress: 27.45%
Download in progress: 27.46%
Download in progress: 27.48%
Download in progress: 27.50%
Download in progress: 27.52%
Download in progress: 27.53%
Download in progress: 27.55%
Download in progress: 27.57%
Download in progress: 27.59%
Download in progress: 27.60%
Download in progress: 27.62%
Download in progress: 27.64%
Download in progress: 27.66%
Download in progress: 27.67%
Download in progress: 27.69%
Download in progress: 27.71%
Download in progress: 27.73%
Download in progress: 27.74%
Download in progress: 27.76%
Download in progress: 27.78%
Download in progress: 27.80%
Download in progress: 27.81%
Download in progress: 27.83%
Download in progress: 27.85%
Download in progress: 27.87%
Download in progress: 27.88%
Download in progress: 27.90%
Download in progress: 27.92%
Download in progress: 27.94%
Download in progress: 27.95%
Download in progress: 27.97%
Download in progress: 27.99%
Download in progress: 28.01%
Download in progress: 28.02%
Download in progress: 28.04%
Download in progress: 28.06%
Download in progress: 28.08%
Download in progress: 28.09%
Download in progress: 28.11%
Download in progress: 28.13%
Download in progress: 28.15%
Download in progress: 28.16%
Download in progress: 28.18%
Download in progress: 28.20%
Download in progress: 28.22%
Download in progress: 28.23%
Download in progress: 28.25%
Download in progress: 28.27%
Download in progress: 28.29%
Download in progress: 28.30%
Download in progress: 28.32%
Download in progress: 28.34%
Download in progress: 28.36%
Download in progress: 28.37%
Download in progress: 28.39%
Download in progress: 28.41%
Download in progress: 28.42%
Download in progress: 28.44%
Download in progress: 28.46%
Download in progress: 28.48%
Download in progress: 28.49%
Download in progress: 28.51%
Download in progress: 28.53%
Download in progress: 28.55%
Download in progress: 28.56%
Download in progress: 28.58%
Download in progress: 28.60%
Download in progress: 28.62%
Download in progress: 28.63%
Download in progress: 28.65%
Download in progress: 28.67%
Download in progress: 28.69%
Download in progress: 28.70%
Download in progress: 28.72%
Download in progress: 28.74%
Download in progress: 28.76%
Download in progress: 28.77%
Download in progress: 28.79%
Download in progress: 28.81%
Download in progress: 28.83%
Download in progress: 28.84%
Download in progress: 28.86%
Download in progress: 28.88%
Download in progress: 28.90%
Download in progress: 28.91%
Download in progress: 28.93%
Download in progress: 28.95%
Download in progress: 28.97%
Download in progress: 28.98%
Download in progress: 29.00%
Download in progress: 29.02%
Download in progress: 29.04%
Download in progress: 29.05%
Download in progress: 29.07%
Download in progress: 29.09%
Download in progress: 29.11%
Download in progress: 29.12%
Download in progress: 29.14%
Download in progress: 29.16%
Download in progress: 29.18%
Download in progress: 29.19%
Download in progress: 29.21%
Download in progress: 29.23%
Download in progress: 29.25%
Download in progress: 29.26%
Download in progress: 29.28%
Download in progress: 29.30%
Download in progress: 29.32%
Download in progress: 29.33%
Download in progress: 29.35%
Download in progress: 29.37%
Download in progress: 29.39%
Download in progress: 29.40%
Download in progress: 29.42%
Download in progress: 29.44%
Download in progress: 29.46%
Download in progress: 29.47%
Download in progress: 29.49%
Download in progress: 29.51%
Download in progress: 29.53%
Download in progress: 29.54%
Download in progress: 29.56%
Download in progress: 29.58%
Download in progress: 29.60%
Download in progress: 29.61%
Download in progress: 29.63%
Download in progress: 29.65%
Download in progress: 29.67%
Download in progress: 29.68%
Download in progress: 29.70%
Download in progress: 29.72%
Download in progress: 29.74%
Download in progress: 29.75%
Download in progress: 29.77%
Download in progress: 29.79%
Download in progress: 29.81%
Download in progress: 29.82%
Download in progress: 29.84%
Download in progress: 29.86%
Download in progress: 29.88%
Download in progress: 29.89%
Download in progress: 29.91%
Download in progress: 29.93%
Download in progress: 29.95%
Download in progress: 29.96%
Download in progress: 29.98%
Download in progress: 30.00%
Download in progress: 30.02%
Download in progress: 30.03%
Download in progress: 30.05%
Download in progress: 30.07%
Download in progress: 30.09%
Download in progress: 30.10%
Download in progress: 30.12%
Download in progress: 30.14%
Download in progress: 30.16%
Download in progress: 30.17%
Download in progress: 30.19%
Download in progress: 30.21%
Download in progress: 30.23%
Download in progress: 30.24%
Download in progress: 30.26%
Download in progress: 30.28%
Download in progress: 30.30%
Download in progress: 30.31%
Download in progress: 30.33%
Download in progress: 30.35%
Download in progress: 30.37%
Download in progress: 30.38%
Download in progress: 30.40%
Download in progress: 30.42%
Download in progress: 30.44%
Download in progress: 30.45%
Download in progress: 30.47%
Download in progress: 30.49%
Download in progress: 30.51%
Download in progress: 30.52%
Download in progress: 30.54%
Download in progress: 30.56%
Download in progress: 30.58%
Download in progress: 30.59%
Download in progress: 30.61%
Download in progress: 30.63%
Download in progress: 30.65%
Download in progress: 30.66%
Download in progress: 30.68%
Download in progress: 30.70%
Download in progress: 30.72%
Download in progress: 30.73%
Download in progress: 30.75%
Download in progress: 30.77%
Download in progress: 30.78%
Download in progress: 30.80%
Download in progress: 30.82%
Download in progress: 30.84%
Download in progress: 30.85%
Download in progress: 30.87%
Download in progress: 30.89%
Download in progress: 30.91%
Download in progress: 30.92%
Download in progress: 30.94%
Download in progress: 30.96%
Download in progress: 30.98%
Download in progress: 30.99%
Download in progress: 31.01%
Download in progress: 31.03%
Download in progress: 31.05%
Download in progress: 31.06%
Download in progress: 31.08%
Download in progress: 31.10%
Download in progress: 31.12%
Download in progress: 31.13%
Download in progress: 31.15%
Download in progress: 31.17%
Download in progress: 31.19%
Download in progress: 31.20%
Download in progress: 31.22%
Download in progress: 31.24%
Download in progress: 31.26%
Download in progress: 31.27%
Download in progress: 31.29%
Download in progress: 31.31%
Download in progress: 31.33%
Download in progress: 31.34%
Download in progress: 31.36%
Download in progress: 31.38%
Download in progress: 31.40%
Download in progress: 31.41%
Download in progress: 31.43%
Download in progress: 31.45%
Download in progress: 31.47%
Download in progress: 31.48%
Download in progress: 31.50%
Download in progress: 31.52%
Download in progress: 31.54%
Download in progress: 31.55%
Download in progress: 31.57%
Download in progress: 31.59%
Download in progress: 31.61%
Download in progress: 31.62%
Download in progress: 31.64%
Download in progress: 31.66%
Download in progress: 31.68%
Download in progress: 31.69%
Download in progress: 31.71%
Download in progress: 31.73%
Download in progress: 31.75%
Download in progress: 31.76%
Download in progress: 31.78%
Download in progress: 31.80%
Download in progress: 31.82%
Download in progress: 31.83%
Download in progress: 31.85%
Download in progress: 31.87%
Download in progress: 31.89%
Download in progress: 31.90%
Download in progress: 31.92%
Download in progress: 31.94%
Download in progress: 31.96%
Download in progress: 31.97%
Download in progress: 31.99%
Download in progress: 32.01%
Download in progress: 32.03%
Download in progress: 32.04%
Download in progress: 32.06%
Download in progress: 32.08%
Download in progress: 32.10%
Download in progress: 32.11%
Download in progress: 32.13%
Download in progress: 32.15%
Download in progress: 32.17%
Download in progress: 32.18%
Download in progress: 32.20%
Download in progress: 32.22%
Download in progress: 32.24%
Download in progress: 32.25%
Download in progress: 32.27%
Download in progress: 32.29%
Download in progress: 32.31%
Download in progress: 32.32%
Download in progress: 32.34%
Download in progress: 32.36%
Download in progress: 32.38%
Download in progress: 32.39%
Download in progress: 32.41%
Download in progress: 32.43%
Download in progress: 32.45%
Download in progress: 32.46%
Download in progress: 32.48%
Download in progress: 32.50%
Download in progress: 32.52%
Download in progress: 32.53%
Download in progress: 32.55%
Download in progress: 32.57%
Download in progress: 32.59%
Download in progress: 32.60%
Download in progress: 32.62%
Download in progress: 32.64%
Download in progress: 32.66%
Download in progress: 32.67%
Download in progress: 32.69%
Download in progress: 32.71%
Download in progress: 32.73%
Download in progress: 32.74%
Download in progress: 32.76%
Download in progress: 32.78%
Download in progress: 32.80%
Download in progress: 32.81%
Download in progress: 32.83%
Download in progress: 32.85%
Download in progress: 32.87%
Download in progress: 32.88%
Download in progress: 32.90%
Download in progress: 32.92%
Download in progress: 32.94%
Download in progress: 32.95%
Download in progress: 32.97%
Download in progress: 32.99%
Download in progress: 33.01%
Download in progress: 33.02%
Download in progress: 33.04%
Download in progress: 33.06%
Download in progress: 33.08%
Download in progress: 33.09%
Download in progress: 33.11%
Download in progress: 33.13%
Download in progress: 33.14%
Download in progress: 33.16%
Download in progress: 33.18%
Download in progress: 33.20%
Download in progress: 33.21%
Download in progress: 33.23%
Download in progress: 33.25%
Download in progress: 33.27%
Download in progress: 33.28%
Download in progress: 33.30%
Download in progress: 33.32%
Download in progress: 33.34%
Download in progress: 33.35%
Download in progress: 33.37%
Download in progress: 33.39%
Download in progress: 33.41%
Download in progress: 33.42%
Download in progress: 33.44%
Download in progress: 33.46%
Download in progress: 33.48%
Download in progress: 33.49%
Download in progress: 33.51%
Download in progress: 33.53%
Download in progress: 33.55%
Download in progress: 33.56%
Download in progress: 33.58%
Download in progress: 33.60%
Download in progress: 33.62%
Download in progress: 33.63%
Download in progress: 33.65%
Download in progress: 33.67%
Download in progress: 33.69%
Download in progress: 33.70%
Download in progress: 33.72%
Download in progress: 33.74%
Download in progress: 33.76%
Download in progress: 33.77%
Download in progress: 33.79%
Download in progress: 33.81%
Download in progress: 33.83%
Download in progress: 33.84%
Download in progress: 33.86%
Download in progress: 33.88%
Download in progress: 33.90%
Download in progress: 33.91%
Download in progress: 33.93%
Download in progress: 33.95%
Download in progress: 33.97%
Download in progress: 33.98%
Download in progress: 34.00%
Download in progress: 34.02%
Download in progress: 34.04%
Download in progress: 34.05%
Download in progress: 34.07%
Download in progress: 34.09%
Download in progress: 34.11%
Download in progress: 34.12%
Download in progress: 34.14%
Download in progress: 34.16%
Download in progress: 34.18%
Download in progress: 34.19%
Download in progress: 34.21%
Download in progress: 34.23%
Download in progress: 34.25%
Download in progress: 34.26%
Download in progress: 34.28%
Download in progress: 34.30%
Download in progress: 34.32%
Download in progress: 34.33%
Download in progress: 34.35%
Download in progress: 34.37%
Download in progress: 34.39%
Download in progress: 34.40%
Download in progress: 34.42%
Download in progress: 34.44%
Download in progress: 34.46%
Download in progress: 34.47%
Download in progress: 34.49%
Download in progress: 34.51%
Download in progress: 34.53%
Download in progress: 34.54%
Download in progress: 34.56%
Download in progress: 34.58%
Download in progress: 34.60%
Download in progress: 34.61%
Download in progress: 34.63%
Download in progress: 34.65%
Download in progress: 34.67%
Download in progress: 34.68%
Download in progress: 34.70%
Download in progress: 34.72%
Download in progress: 34.74%
Download in progress: 34.75%
Download in progress: 34.77%
Download in progress: 34.79%
Download in progress: 34.81%
Download in progress: 34.82%
Download in progress: 34.84%
Download in progress: 34.86%
Download in progress: 34.88%
Download in progress: 34.89%
Download in progress: 34.91%
Download in progress: 34.93%
Download in progress: 34.95%
Download in progress: 34.96%
Download in progress: 34.98%
Download in progress: 35.00%
Download in progress: 35.02%
Download in progress: 35.03%
Download in progress: 35.05%
Download in progress: 35.07%
Download in progress: 35.09%
Download in progress: 35.10%
Download in progress: 35.12%
Download in progress: 35.14%
Download in progress: 35.16%
Download in progress: 35.17%
Download in progress: 35.19%
Download in progress: 35.21%
Download in progress: 35.23%
Download in progress: 35.24%
Download in progress: 35.26%
Download in progress: 35.28%
Download in progress: 35.30%
Download in progress: 35.31%
Download in progress: 35.33%
Download in progress: 35.35%
Download in progress: 35.37%
Download in progress: 35.38%
Download in progress: 35.40%
Download in progress: 35.42%
Download in progress: 35.44%
Download in progress: 35.45%
Download in progress: 35.47%
Download in progress: 35.49%
Download in progress: 35.50%
Download in progress: 35.52%
Download in progress: 35.54%
Download in progress: 35.56%
Download in progress: 35.57%
Download in progress: 35.59%
Download in progress: 35.61%
Download in progress: 35.63%
Download in progress: 35.64%
Download in progress: 35.66%
Download in progress: 35.68%
Download in progress: 35.70%
Download in progress: 35.71%
Download in progress: 35.73%
Download in progress: 35.75%
Download in progress: 35.77%
Download in progress: 35.78%
Download in progress: 35.80%
Download in progress: 35.82%
Download in progress: 35.84%
Download in progress: 35.85%
Download in progress: 35.87%
Download in progress: 35.89%
Download in progress: 35.91%
Download in progress: 35.92%
Download in progress: 35.94%
Download in progress: 35.96%
Download in progress: 35.98%
Download in progress: 35.99%
Download in progress: 36.01%
Download in progress: 36.03%
Download in progress: 36.05%
Download in progress: 36.06%
Download in progress: 36.08%
Download in progress: 36.10%
Download in progress: 36.12%
Download in progress: 36.13%
Download in progress: 36.15%
Download in progress: 36.17%
Download in progress: 36.19%
Download in progress: 36.20%
Download in progress: 36.22%
Download in progress: 36.24%
Download in progress: 36.26%
Download in progress: 36.27%
Download in progress: 36.29%
Download in progress: 36.31%
Download in progress: 36.33%
Download in progress: 36.34%
Download in progress: 36.36%
Download in progress: 36.38%
Download in progress: 36.40%
Download in progress: 36.41%
Download in progress: 36.43%
Download in progress: 36.45%
Download in progress: 36.47%
Download in progress: 36.48%
Download in progress: 36.50%
Download in progress: 36.52%
Download in progress: 36.54%
Download in progress: 36.55%
Download in progress: 36.57%
Download in progress: 36.59%
Download in progress: 36.61%
Download in progress: 36.62%
Download in progress: 36.64%
Download in progress: 36.66%
Download in progress: 36.68%
Download in progress: 36.69%
Download in progress: 36.71%
Download in progress: 36.73%
Download in progress: 36.75%
Download in progress: 36.76%
Download in progress: 36.78%
Download in progress: 36.80%
Download in progress: 36.82%
Download in progress: 36.83%
Download in progress: 36.85%
Download in progress: 36.87%
Download in progress: 36.89%
Download in progress: 36.90%
Download in progress: 36.92%
Download in progress: 36.94%
Download in progress: 36.96%
Download in progress: 36.97%
Download in progress: 36.99%
Download in progress: 37.01%
Download in progress: 37.03%
Download in progress: 37.04%
Download in progress: 37.06%
Download in progress: 37.08%
Download in progress: 37.10%
Download in progress: 37.11%
Download in progress: 37.13%
Download in progress: 37.15%
Download in progress: 37.17%
Download in progress: 37.18%
Download in progress: 37.20%
Download in progress: 37.22%
Download in progress: 37.24%
Download in progress: 37.25%
Download in progress: 37.27%
Download in progress: 37.29%
Download in progress: 37.31%
Download in progress: 37.32%
Download in progress: 37.34%
Download in progress: 37.36%
Download in progress: 37.38%
Download in progress: 37.39%
Download in progress: 37.41%
Download in progress: 37.43%
Download in progress: 37.45%
Download in progress: 37.46%
Download in progress: 37.48%
Download in progress: 37.50%
Download in progress: 37.52%
Download in progress: 37.53%
Download in progress: 37.55%
Download in progress: 37.57%
Download in progress: 37.59%
Download in progress: 37.60%
Download in progress: 37.62%
Download in progress: 37.64%
Download in progress: 37.66%
Download in progress: 37.67%
Download in progress: 37.69%
Download in progress: 37.71%
Download in progress: 37.73%
Download in progress: 37.74%
Download in progress: 37.76%
Download in progress: 37.78%
Download in progress: 37.80%
Download in progress: 37.81%
Download in progress: 37.83%
Download in progress: 37.85%
Download in progress: 37.86%
Download in progress: 37.88%
Download in progress: 37.90%
Download in progress: 37.92%
Download in progress: 37.93%
Download in progress: 37.95%
Download in progress: 37.97%
Download in progress: 37.99%
Download in progress: 38.00%
Download in progress: 38.02%
Download in progress: 38.04%
Download in progress: 38.06%
Download in progress: 38.07%
Download in progress: 38.09%
Download in progress: 38.11%
Download in progress: 38.13%
Download in progress: 38.14%
Download in progress: 38.16%
Download in progress: 38.18%
Download in progress: 38.20%
Download in progress: 38.21%
Download in progress: 38.23%
Download in progress: 38.25%
Download in progress: 38.27%
Download in progress: 38.28%
Download in progress: 38.30%
Download in progress: 38.32%
Download in progress: 38.34%
Download in progress: 38.35%
Download in progress: 38.37%
Download in progress: 38.39%
Download in progress: 38.41%
Download in progress: 38.42%
Download in progress: 38.44%
Download in progress: 38.46%
Download in progress: 38.48%
Download in progress: 38.49%
Download in progress: 38.51%
Download in progress: 38.53%
Download in progress: 38.55%
Download in progress: 38.56%
Download in progress: 38.58%
Download in progress: 38.60%
Download in progress: 38.62%
Download in progress: 38.63%
Download in progress: 38.65%
Download in progress: 38.67%
Download in progress: 38.69%
Download in progress: 38.70%
Download in progress: 38.72%
Download in progress: 38.74%
Download in progress: 38.76%
Download in progress: 38.77%
Download in progress: 38.79%
Download in progress: 38.81%
Download in progress: 38.83%
Download in progress: 38.84%
Download in progress: 38.86%
Download in progress: 38.88%
Download in progress: 38.90%
Download in progress: 38.91%
Download in progress: 38.93%
Download in progress: 38.95%
Download in progress: 38.97%
Download in progress: 38.98%
Download in progress: 39.00%
Download in progress: 39.02%
Download in progress: 39.04%
Download in progress: 39.05%
Download in progress: 39.07%
Download in progress: 39.09%
Download in progress: 39.11%
Download in progress: 39.12%
Download in progress: 39.14%
Download in progress: 39.16%
Download in progress: 39.18%
Download in progress: 39.19%
Download in progress: 39.21%
Download in progress: 39.23%
Download in progress: 39.25%
Download in progress: 39.26%
Download in progress: 39.28%
Download in progress: 39.30%
Download in progress: 39.32%
Download in progress: 39.33%
Download in progress: 39.35%
Download in progress: 39.37%
Download in progress: 39.39%
Download in progress: 39.40%
Download in progress: 39.42%
Download in progress: 39.44%
Download in progress: 39.46%
Download in progress: 39.47%
Download in progress: 39.49%
Download in progress: 39.51%
Download in progress: 39.53%
Download in progress: 39.54%
Download in progress: 39.56%
Download in progress: 39.58%
Download in progress: 39.60%
Download in progress: 39.61%
Download in progress: 39.63%
Download in progress: 39.65%
Download in progress: 39.67%
Download in progress: 39.68%
Download in progress: 39.70%
Download in progress: 39.72%
Download in progress: 39.74%
Download in progress: 39.75%
Download in progress: 39.77%
Download in progress: 39.79%
Download in progress: 39.81%
Download in progress: 39.82%
Download in progress: 39.84%
Download in progress: 39.86%
Download in progress: 39.88%
Download in progress: 39.89%
Download in progress: 39.91%
Download in progress: 39.93%
Download in progress: 39.95%
Download in progress: 39.96%
Download in progress: 39.98%
Download in progress: 40.00%
Download in progress: 40.02%
Download in progress: 40.03%
Download in progress: 40.05%
Download in progress: 40.07%
Download in progress: 40.09%
Download in progress: 40.10%
Download in progress: 40.12%
Download in progress: 40.14%
Download in progress: 40.16%
Download in progress: 40.17%
Download in progress: 40.19%
Download in progress: 40.21%
Download in progress: 40.23%
Download in progress: 40.24%
Download in progress: 40.26%
Download in progress: 40.28%
Download in progress: 40.29%
Download in progress: 40.31%
Download in progress: 40.33%
Download in progress: 40.35%
Download in progress: 40.36%
Download in progress: 40.38%
Download in progress: 40.40%
Download in progress: 40.42%
Download in progress: 40.43%
Download in progress: 40.45%
Download in progress: 40.47%
Download in progress: 40.49%
Download in progress: 40.50%
Download in progress: 40.52%
Download in progress: 40.54%
Download in progress: 40.56%
Download in progress: 40.57%
Download in progress: 40.59%
Download in progress: 40.61%
Download in progress: 40.63%
Download in progress: 40.64%
Download in progress: 40.66%
Download in progress: 40.68%
Download in progress: 40.70%
Download in progress: 40.71%
Download in progress: 40.73%
Download in progress: 40.75%
Download in progress: 40.77%
Download in progress: 40.78%
Download in progress: 40.80%
Download in progress: 40.82%
Download in progress: 40.84%
Download in progress: 40.85%
Download in progress: 40.87%
Download in progress: 40.89%
Download in progress: 40.91%
Download in progress: 40.92%
Download in progress: 40.94%
Download in progress: 40.96%
Download in progress: 40.98%
Download in progress: 40.99%
Download in progress: 41.01%
Download in progress: 41.03%
Download in progress: 41.05%
Download in progress: 41.06%
Download in progress: 41.08%
Download in progress: 41.10%
Download in progress: 41.12%
Download in progress: 41.13%
Download in progress: 41.15%
Download in progress: 41.17%
Download in progress: 41.19%
Download in progress: 41.20%
Download in progress: 41.22%
Download in progress: 41.24%
Download in progress: 41.26%
Download in progress: 41.27%
Download in progress: 41.29%
Download in progress: 41.31%
Download in progress: 41.33%
Download in progress: 41.34%
Download in progress: 41.36%
Download in progress: 41.38%
Download in progress: 41.40%
Download in progress: 41.41%
Download in progress: 41.43%
Download in progress: 41.45%
Download in progress: 41.47%
Download in progress: 41.48%
Download in progress: 41.50%
Download in progress: 41.52%
Download in progress: 41.54%
Download in progress: 41.55%
Download in progress: 41.57%
Download in progress: 41.59%
Download in progress: 41.61%
Download in progress: 41.62%
Download in progress: 41.64%
Download in progress: 41.66%
Download in progress: 41.68%
Download in progress: 41.69%
Download in progress: 41.71%
Download in progress: 41.73%
Download in progress: 41.75%
Download in progress: 41.76%
Download in progress: 41.78%
Download in progress: 41.80%
Download in progress: 41.82%
Download in progress: 41.83%
Download in progress: 41.85%
Download in progress: 41.87%
Download in progress: 41.89%
Download in progress: 41.90%
Download in progress: 41.92%
Download in progress: 41.94%
Download in progress: 41.96%
Download in progress: 41.97%
Download in progress: 41.99%
Download in progress: 42.01%
Download in progress: 42.03%
Download in progress: 42.04%
Download in progress: 42.06%
Download in progress: 42.08%
Download in progress: 42.10%
Download in progress: 42.11%
Download in progress: 42.13%
Download in progress: 42.15%
Download in progress: 42.17%
Download in progress: 42.18%
Download in progress: 42.20%
Download in progress: 42.22%
Download in progress: 42.24%
Download in progress: 42.25%
Download in progress: 42.27%
Download in progress: 42.29%
Download in progress: 42.31%
Download in progress: 42.32%
Download in progress: 42.34%
Download in progress: 42.36%
Download in progress: 42.38%
Download in progress: 42.39%
Download in progress: 42.41%
Download in progress: 42.43%
Download in progress: 42.45%
Download in progress: 42.46%
Download in progress: 42.48%
Download in progress: 42.50%
Download in progress: 42.52%
Download in progress: 42.53%
Download in progress: 42.55%
Download in progress: 42.57%
Download in progress: 42.59%
Download in progress: 42.60%
Download in progress: 42.62%
Download in progress: 42.64%
Download in progress: 42.65%
Download in progress: 42.67%
Download in progress: 42.69%
Download in progress: 42.71%
Download in progress: 42.72%
Download in progress: 42.74%
Download in progress: 42.76%
Download in progress: 42.78%
Download in progress: 42.79%
Download in progress: 42.81%
Download in progress: 42.83%
Download in progress: 42.85%
Download in progress: 42.86%
Download in progress: 42.88%
Download in progress: 42.90%
Download in progress: 42.92%
Download in progress: 42.93%
Download in progress: 42.95%
Download in progress: 42.97%
Download in progress: 42.99%
Download in progress: 43.00%
Download in progress: 43.02%
Download in progress: 43.04%
Download in progress: 43.06%
Download in progress: 43.07%
Download in progress: 43.09%
Download in progress: 43.11%
Download in progress: 43.13%
Download in progress: 43.14%
Download in progress: 43.16%
Download in progress: 43.18%
Download in progress: 43.20%
Download in progress: 43.21%
Download in progress: 43.23%
Download in progress: 43.25%
Download in progress: 43.27%
Download in progress: 43.28%
Download in progress: 43.30%
Download in progress: 43.32%
Download in progress: 43.34%
Download in progress: 43.35%
Download in progress: 43.37%
Download in progress: 43.39%
Download in progress: 43.41%
Download in progress: 43.42%
Download in progress: 43.44%
Download in progress: 43.46%
Download in progress: 43.48%
Download in progress: 43.49%
Download in progress: 43.51%
Download in progress: 43.53%
Download in progress: 43.55%
Download in progress: 43.56%
Download in progress: 43.58%
Download in progress: 43.60%
Download in progress: 43.62%
Download in progress: 43.63%
Download in progress: 43.65%
Download in progress: 43.67%
Download in progress: 43.69%
Download in progress: 43.70%
Download in progress: 43.72%
Download in progress: 43.74%
Download in progress: 43.76%
Download in progress: 43.77%
Download in progress: 43.79%
Download in progress: 43.81%
Download in progress: 43.83%
Download in progress: 43.84%
Download in progress: 43.86%
Download in progress: 43.88%
Download in progress: 43.90%
Download in progress: 43.91%
Download in progress: 43.93%
Download in progress: 43.95%
Download in progress: 43.97%
Download in progress: 43.98%
Download in progress: 44.00%
Download in progress: 44.02%
Download in progress: 44.04%
Download in progress: 44.05%
Download in progress: 44.07%
Download in progress: 44.09%
Download in progress: 44.11%
Download in progress: 44.12%
Download in progress: 44.14%
Download in progress: 44.16%
Download in progress: 44.18%
Download in progress: 44.19%
Download in progress: 44.21%
Download in progress: 44.23%
Download in progress: 44.25%
Download in progress: 44.26%
Download in progress: 44.28%
Download in progress: 44.30%
Download in progress: 44.32%
Download in progress: 44.33%
Download in progress: 44.35%
Download in progress: 44.37%
Download in progress: 44.39%
Download in progress: 44.40%
Download in progress: 44.42%
Download in progress: 44.44%
Download in progress: 44.46%
Download in progress: 44.47%
Download in progress: 44.49%
Download in progress: 44.51%
Download in progress: 44.53%
Download in progress: 44.54%
Download in progress: 44.56%
Download in progress: 44.58%
Download in progress: 44.60%
Download in progress: 44.61%
Download in progress: 44.63%
Download in progress: 44.65%
Download in progress: 44.67%
Download in progress: 44.68%
Download in progress: 44.70%
Download in progress: 44.72%
Download in progress: 44.74%
Download in progress: 44.75%
Download in progress: 44.77%
Download in progress: 44.79%
Download in progress: 44.81%
Download in progress: 44.82%
Download in progress: 44.84%
Download in progress: 44.86%
Download in progress: 44.88%
Download in progress: 44.89%
Download in progress: 44.91%
Download in progress: 44.93%
Download in progress: 44.95%
Download in progress: 44.96%
Download in progress: 44.98%
Download in progress: 45.00%
Download in progress: 45.01%
Download in progress: 45.03%
Download in progress: 45.05%
Download in progress: 45.07%
Download in progress: 45.08%
Download in progress: 45.10%
Download in progress: 45.12%
Download in progress: 45.14%
Download in progress: 45.15%
Download in progress: 45.17%
Download in progress: 45.19%
Download in progress: 45.21%
Download in progress: 45.22%
Download in progress: 45.24%
Download in progress: 45.26%
Download in progress: 45.28%
Download in progress: 45.29%
Download in progress: 45.31%
Download in progress: 45.33%
Download in progress: 45.35%
Download in progress: 45.36%
Download in progress: 45.38%
Download in progress: 45.40%
Download in progress: 45.42%
Download in progress: 45.43%
Download in progress: 45.45%
Download in progress: 45.47%
Download in progress: 45.49%
Download in progress: 45.50%
Download in progress: 45.52%
Download in progress: 45.54%
Download in progress: 45.56%
Download in progress: 45.57%
Download in progress: 45.59%
Download in progress: 45.61%
Download in progress: 45.63%
Download in progress: 45.64%
Download in progress: 45.66%
Download in progress: 45.68%
Download in progress: 45.70%
Download in progress: 45.71%
Download in progress: 45.73%
Download in progress: 45.75%
Download in progress: 45.77%
Download in progress: 45.78%
Download in progress: 45.80%
Download in progress: 45.82%
Download in progress: 45.84%
Download in progress: 45.85%
Download in progress: 45.87%
Download in progress: 45.89%
Download in progress: 45.91%
Download in progress: 45.92%
Download in progress: 45.94%
Download in progress: 45.96%
Download in progress: 45.98%
Download in progress: 45.99%
Download in progress: 46.01%
Download in progress: 46.03%
Download in progress: 46.05%
Download in progress: 46.06%
Download in progress: 46.08%
Download in progress: 46.10%
Download in progress: 46.12%
Download in progress: 46.13%
Download in progress: 46.15%
Download in progress: 46.17%
Download in progress: 46.19%
Download in progress: 46.20%
Download in progress: 46.22%
Download in progress: 46.24%
Download in progress: 46.26%
Download in progress: 46.27%
Download in progress: 46.29%
Download in progress: 46.31%
Download in progress: 46.33%
Download in progress: 46.34%
Download in progress: 46.36%
Download in progress: 46.38%
Download in progress: 46.40%
Download in progress: 46.41%
Download in progress: 46.43%
Download in progress: 46.45%
Download in progress: 46.47%
Download in progress: 46.48%
Download in progress: 46.50%
Download in progress: 46.52%
Download in progress: 46.54%
Download in progress: 46.55%
Download in progress: 46.57%
Download in progress: 46.59%
Download in progress: 46.61%
Download in progress: 46.62%
Download in progress: 46.64%
Download in progress: 46.66%
Download in progress: 46.68%
Download in progress: 46.69%
Download in progress: 46.71%
Download in progress: 46.73%
Download in progress: 46.75%
Download in progress: 46.76%
Download in progress: 46.78%
Download in progress: 46.80%
Download in progress: 46.82%
Download in progress: 46.83%
Download in progress: 46.85%
Download in progress: 46.87%
Download in progress: 46.89%
Download in progress: 46.90%
Download in progress: 46.92%
Download in progress: 46.94%
Download in progress: 46.96%
Download in progress: 46.97%
Download in progress: 46.99%
Download in progress: 47.01%
Download in progress: 47.03%
Download in progress: 47.04%
Download in progress: 47.06%
Download in progress: 47.08%
Download in progress: 47.10%
Download in progress: 47.11%
Download in progress: 47.13%
Download in progress: 47.15%
Download in progress: 47.17%
Download in progress: 47.18%
Download in progress: 47.20%
Download in progress: 47.22%
Download in progress: 47.24%
Download in progress: 47.25%
Download in progress: 47.27%
Download in progress: 47.29%
Download in progress: 47.31%
Download in progress: 47.32%
Download in progress: 47.34%
Download in progress: 47.36%
Download in progress: 47.37%
Download in progress: 47.39%
Download in progress: 47.41%
Download in progress: 47.43%
Download in progress: 47.44%
Download in progress: 47.46%
Download in progress: 47.48%
Download in progress: 47.50%
Download in progress: 47.51%
Download in progress: 47.53%
Download in progress: 47.55%
Download in progress: 47.57%
Download in progress: 47.58%
Download in progress: 47.60%
Download in progress: 47.62%
Download in progress: 47.64%
Download in progress: 47.65%
Download in progress: 47.67%
Download in progress: 47.69%
Download in progress: 47.71%
Download in progress: 47.72%
Download in progress: 47.74%
Download in progress: 47.76%
Download in progress: 47.78%
Download in progress: 47.79%
Download in progress: 47.81%
Download in progress: 47.83%
Download in progress: 47.85%
Download in progress: 47.86%
Download in progress: 47.88%
Download in progress: 47.90%
Download in progress: 47.92%
Download in progress: 47.93%
Download in progress: 47.95%
Download in progress: 47.97%
Download in progress: 47.99%
Download in progress: 48.00%
Download in progress: 48.02%
Download in progress: 48.04%
Download in progress: 48.06%
Download in progress: 48.07%
Download in progress: 48.09%
Download in progress: 48.11%
Download in progress: 48.13%
Download in progress: 48.14%
Download in progress: 48.16%
Download in progress: 48.18%
Download in progress: 48.20%
Download in progress: 48.21%
Download in progress: 48.23%
Download in progress: 48.25%
Download in progress: 48.27%
Download in progress: 48.28%
Download in progress: 48.30%
Download in progress: 48.32%
Download in progress: 48.34%
Download in progress: 48.35%
Download in progress: 48.37%
Download in progress: 48.39%
Download in progress: 48.41%
Download in progress: 48.42%
Download in progress: 48.44%
Download in progress: 48.46%
Download in progress: 48.48%
Download in progress: 48.49%
Download in progress: 48.51%
Download in progress: 48.53%
Download in progress: 48.55%
Download in progress: 48.56%
Download in progress: 48.58%
Download in progress: 48.60%
Download in progress: 48.62%
Download in progress: 48.63%
Download in progress: 48.65%
Download in progress: 48.67%
Download in progress: 48.69%
Download in progress: 48.70%
Download in progress: 48.72%
Download in progress: 48.74%
Download in progress: 48.76%
Download in progress: 48.77%
Download in progress: 48.79%
Download in progress: 48.81%
Download in progress: 48.83%
Download in progress: 48.84%
Download in progress: 48.86%
Download in progress: 48.88%
Download in progress: 48.90%
Download in progress: 48.91%
Download in progress: 48.93%
Download in progress: 48.95%
Download in progress: 48.97%
Download in progress: 48.98%
Download in progress: 49.00%
Download in progress: 49.02%
Download in progress: 49.04%
Download in progress: 49.05%
Download in progress: 49.07%
Download in progress: 49.09%
Download in progress: 49.11%
Download in progress: 49.12%
Download in progress: 49.14%
Download in progress: 49.16%
Download in progress: 49.18%
Download in progress: 49.19%
Download in progress: 49.21%
Download in progress: 49.23%
Download in progress: 49.25%
Download in progress: 49.26%
Download in progress: 49.28%
Download in progress: 49.30%
Download in progress: 49.32%
Download in progress: 49.33%
Download in progress: 49.35%
Download in progress: 49.37%
Download in progress: 49.39%
Download in progress: 49.40%
Download in progress: 49.42%
Download in progress: 49.44%
Download in progress: 49.46%
Download in progress: 49.47%
Download in progress: 49.49%
Download in progress: 49.51%
Download in progress: 49.53%
Download in progress: 49.54%
Download in progress: 49.56%
Download in progress: 49.58%
Download in progress: 49.60%
Download in progress: 49.61%
Download in progress: 49.63%
Download in progress: 49.65%
Download in progress: 49.67%
Download in progress: 49.68%
Download in progress: 49.70%
Download in progress: 49.72%
Download in progress: 49.73%
Download in progress: 49.75%
Download in progress: 49.77%
Download in progress: 49.79%
Download in progress: 49.80%
Download in progress: 49.82%
Download in progress: 49.84%
Download in progress: 49.86%
Download in progress: 49.87%
Download in progress: 49.89%
Download in progress: 49.91%
Download in progress: 49.93%
Download in progress: 49.94%
Download in progress: 49.96%
Download in progress: 49.98%
Download in progress: 50.00%
Download in progress: 50.01%
Download in progress: 50.03%
Download in progress: 50.05%
Download in progress: 50.07%
Download in progress: 50.08%
Download in progress: 50.10%
Download in progress: 50.12%
Download in progress: 50.14%
Download in progress: 50.15%
Download in progress: 50.17%
Download in progress: 50.19%
Download in progress: 50.21%
Download in progress: 50.22%
Download in progress: 50.24%
Download in progress: 50.26%
Download in progress: 50.28%
Download in progress: 50.29%
Download in progress: 50.31%
Download in progress: 50.33%
Download in progress: 50.35%
Download in progress: 50.36%
Download in progress: 50.38%
Download in progress: 50.40%
Download in progress: 50.42%
Download in progress: 50.43%
Download in progress: 50.45%
Download in progress: 50.47%
Download in progress: 50.49%
Download in progress: 50.50%
Download in progress: 50.52%
Download in progress: 50.54%
Download in progress: 50.56%
Download in progress: 50.57%
Download in progress: 50.59%
Download in progress: 50.61%
Download in progress: 50.63%
Download in progress: 50.64%
Download in progress: 50.66%
Download in progress: 50.68%
Download in progress: 50.70%
Download in progress: 50.71%
Download in progress: 50.73%
Download in progress: 50.75%
Download in progress: 50.77%
Download in progress: 50.78%
Download in progress: 50.80%
Download in progress: 50.82%
Download in progress: 50.84%
Download in progress: 50.85%
Download in progress: 50.87%
Download in progress: 50.89%
Download in progress: 50.91%
Download in progress: 50.92%
Download in progress: 50.94%
Download in progress: 50.96%
Download in progress: 50.98%
Download in progress: 50.99%
Download in progress: 51.01%
Download in progress: 51.03%
Download in progress: 51.05%
Download in progress: 51.06%
Download in progress: 51.08%
Download in progress: 51.10%
Download in progress: 51.12%
Download in progress: 51.13%
Download in progress: 51.15%
Download in progress: 51.17%
Download in progress: 51.19%
Download in progress: 51.20%
Download in progress: 51.22%
Download in progress: 51.24%
Download in progress: 51.26%
Download in progress: 51.27%
Download in progress: 51.29%
Download in progress: 51.31%
Download in progress: 51.33%
Download in progress: 51.34%
Download in progress: 51.36%
Download in progress: 51.38%
Download in progress: 51.40%
Download in progress: 51.41%
Download in progress: 51.43%
Download in progress: 51.45%
Download in progress: 51.47%
Download in progress: 51.48%
Download in progress: 51.50%
Download in progress: 51.52%
Download in progress: 51.54%
Download in progress: 51.55%
Download in progress: 51.57%
Download in progress: 51.59%
Download in progress: 51.61%
Download in progress: 51.62%
Download in progress: 51.64%
Download in progress: 51.66%
Download in progress: 51.68%
Download in progress: 51.69%
Download in progress: 51.71%
Download in progress: 51.73%
Download in progress: 51.75%
Download in progress: 51.76%
Download in progress: 51.78%
Download in progress: 51.80%
Download in progress: 51.82%
Download in progress: 51.83%
Download in progress: 51.85%
Download in progress: 51.87%
Download in progress: 51.89%
Download in progress: 51.90%
Download in progress: 51.92%
Download in progress: 51.94%
Download in progress: 51.96%
Download in progress: 51.97%
Download in progress: 51.99%
Download in progress: 52.01%
Download in progress: 52.03%
Download in progress: 52.04%
Download in progress: 52.06%
Download in progress: 52.08%
Download in progress: 52.09%
Download in progress: 52.11%
Download in progress: 52.13%
Download in progress: 52.15%
Download in progress: 52.16%
Download in progress: 52.18%
Download in progress: 52.20%
Download in progress: 52.22%
Download in progress: 52.23%
Download in progress: 52.25%
Download in progress: 52.27%
Download in progress: 52.29%
Download in progress: 52.30%
Download in progress: 52.32%
Download in progress: 52.34%
Download in progress: 52.36%
Download in progress: 52.37%
Download in progress: 52.39%
Download in progress: 52.41%
Download in progress: 52.43%
Download in progress: 52.44%
Download in progress: 52.46%
Download in progress: 52.48%
Download in progress: 52.50%
Download in progress: 52.51%
Download in progress: 52.53%
Download in progress: 52.55%
Download in progress: 52.57%
Download in progress: 52.58%
Download in progress: 52.60%
Download in progress: 52.62%
Download in progress: 52.64%
Download in progress: 52.65%
Download in progress: 52.67%
Download in progress: 52.69%
Download in progress: 52.71%
Download in progress: 52.72%
Download in progress: 52.74%
Download in progress: 52.76%
Download in progress: 52.78%
Download in progress: 52.79%
Download in progress: 52.81%
Download in progress: 52.83%
Download in progress: 52.85%
Download in progress: 52.86%
Download in progress: 52.88%
Download in progress: 52.90%
Download in progress: 52.92%
Download in progress: 52.93%
Download in progress: 52.95%
Download in progress: 52.97%
Download in progress: 52.99%
Download in progress: 53.00%
Download in progress: 53.02%
Download in progress: 53.04%
Download in progress: 53.06%
Download in progress: 53.07%
Download in progress: 53.09%
Download in progress: 53.11%
Download in progress: 53.13%
Download in progress: 53.14%
Download in progress: 53.16%
Download in progress: 53.18%
Download in progress: 53.20%
Download in progress: 53.21%
Download in progress: 53.23%
Download in progress: 53.25%
Download in progress: 53.27%
Download in progress: 53.28%
Download in progress: 53.30%
Download in progress: 53.32%
Download in progress: 53.34%
Download in progress: 53.35%
Download in progress: 53.37%
Download in progress: 53.39%
Download in progress: 53.41%
Download in progress: 53.42%
Download in progress: 53.44%
Download in progress: 53.46%
Download in progress: 53.48%
Download in progress: 53.49%
Download in progress: 53.51%
Download in progress: 53.53%
Download in progress: 53.55%
Download in progress: 53.56%
Download in progress: 53.58%
Download in progress: 53.60%
Download in progress: 53.62%
Download in progress: 53.63%
Download in progress: 53.65%
Download in progress: 53.67%
Download in progress: 53.69%
Download in progress: 53.70%
Download in progress: 53.72%
Download in progress: 53.74%
Download in progress: 53.76%
Download in progress: 53.77%
Download in progress: 53.79%
Download in progress: 53.81%
Download in progress: 53.83%
Download in progress: 53.84%
Download in progress: 53.86%
Download in progress: 53.88%
Download in progress: 53.90%
Download in progress: 53.91%
Download in progress: 53.93%
Download in progress: 53.95%
Download in progress: 53.97%
Download in progress: 53.98%
Download in progress: 54.00%
Download in progress: 54.02%
Download in progress: 54.04%
Download in progress: 54.05%
Download in progress: 54.07%
Download in progress: 54.09%
Download in progress: 54.11%
Download in progress: 54.12%
Download in progress: 54.14%
Download in progress: 54.16%
Download in progress: 54.18%
Download in progress: 54.19%
Download in progress: 54.21%
Download in progress: 54.23%
Download in progress: 54.25%
Download in progress: 54.26%
Download in progress: 54.28%
Download in progress: 54.30%
Download in progress: 54.32%
Download in progress: 54.33%
Download in progress: 54.35%
Download in progress: 54.37%
Download in progress: 54.39%
Download in progress: 54.40%
Download in progress: 54.42%
Download in progress: 54.44%
Download in progress: 54.45%
Download in progress: 54.47%
Download in progress: 54.49%
Download in progress: 54.51%
Download in progress: 54.52%
Download in progress: 54.54%
Download in progress: 54.56%
Download in progress: 54.58%
Download in progress: 54.59%
Download in progress: 54.61%
Download in progress: 54.63%
Download in progress: 54.65%
Download in progress: 54.66%
Download in progress: 54.68%
Download in progress: 54.70%
Download in progress: 54.72%
Download in progress: 54.73%
Download in progress: 54.75%
Download in progress: 54.77%
Download in progress: 54.79%
Download in progress: 54.80%
Download in progress: 54.82%
Download in progress: 54.84%
Download in progress: 54.86%
Download in progress: 54.87%
Download in progress: 54.89%
Download in progress: 54.91%
Download in progress: 54.93%
Download in progress: 54.94%
Download in progress: 54.96%
Download in progress: 54.98%
Download in progress: 55.00%
Download in progress: 55.01%
Download in progress: 55.03%
Download in progress: 55.05%
Download in progress: 55.07%
Download in progress: 55.08%
Download in progress: 55.10%
Download in progress: 55.12%
Download in progress: 55.14%
Download in progress: 55.15%
Download in progress: 55.17%
Download in progress: 55.19%
Download in progress: 55.21%
Download in progress: 55.22%
Download in progress: 55.24%
Download in progress: 55.26%
Download in progress: 55.28%
Download in progress: 55.29%
Download in progress: 55.31%
Download in progress: 55.33%
Download in progress: 55.35%
Download in progress: 55.36%
Download in progress: 55.38%
Download in progress: 55.40%
Download in progress: 55.42%
Download in progress: 55.43%
Download in progress: 55.45%
Download in progress: 55.47%
Download in progress: 55.49%
Download in progress: 55.50%
Download in progress: 55.52%
Download in progress: 55.54%
Download in progress: 55.56%
Download in progress: 55.57%
Download in progress: 55.59%
Download in progress: 55.61%
Download in progress: 55.63%
Download in progress: 55.64%
Download in progress: 55.66%
Download in progress: 55.68%
Download in progress: 55.70%
Download in progress: 55.71%
Download in progress: 55.73%
Download in progress: 55.75%
Download in progress: 55.77%
Download in progress: 55.78%
Download in progress: 55.80%
Download in progress: 55.82%
Download in progress: 55.84%
Download in progress: 55.85%
Download in progress: 55.87%
Download in progress: 55.89%
Download in progress: 55.91%
Download in progress: 55.92%
Download in progress: 55.94%
Download in progress: 55.96%
Download in progress: 55.98%
Download in progress: 55.99%
Download in progress: 56.01%
Download in progress: 56.03%
Download in progress: 56.05%
Download in progress: 56.06%
Download in progress: 56.08%
Download in progress: 56.10%
Download in progress: 56.12%
Download in progress: 56.13%
Download in progress: 56.15%
Download in progress: 56.17%
Download in progress: 56.19%
Download in progress: 56.20%
Download in progress: 56.22%
Download in progress: 56.24%
Download in progress: 56.26%
Download in progress: 56.27%
Download in progress: 56.29%
Download in progress: 56.31%
Download in progress: 56.33%
Download in progress: 56.34%
Download in progress: 56.36%
Download in progress: 56.38%
Download in progress: 56.40%
Download in progress: 56.41%
Download in progress: 56.43%
Download in progress: 56.45%
Download in progress: 56.47%
Download in progress: 56.48%
Download in progress: 56.50%
Download in progress: 56.52%
Download in progress: 56.54%
Download in progress: 56.55%
Download in progress: 56.57%
Download in progress: 56.59%
Download in progress: 56.61%
Download in progress: 56.62%
Download in progress: 56.64%
Download in progress: 56.66%
Download in progress: 56.68%
Download in progress: 56.69%
Download in progress: 56.71%
Download in progress: 56.73%
Download in progress: 56.75%
Download in progress: 56.76%
Download in progress: 56.78%
Download in progress: 56.80%
Download in progress: 56.81%
Download in progress: 56.83%
Download in progress: 56.85%
Download in progress: 56.87%
Download in progress: 56.88%
Download in progress: 56.90%
Download in progress: 56.92%
Download in progress: 56.94%
Download in progress: 56.95%
Download in progress: 56.97%
Download in progress: 56.99%
Download in progress: 57.01%
Download in progress: 57.02%
Download in progress: 57.04%
Download in progress: 57.06%
Download in progress: 57.08%
Download in progress: 57.09%
Download in progress: 57.11%
Download in progress: 57.13%
Download in progress: 57.15%
Download in progress: 57.16%
Download in progress: 57.18%
Download in progress: 57.20%
Download in progress: 57.22%
Download in progress: 57.23%
Download in progress: 57.25%
Download in progress: 57.27%
Download in progress: 57.29%
Download in progress: 57.30%
Download in progress: 57.32%
Download in progress: 57.34%
Download in progress: 57.36%
Download in progress: 57.37%
Download in progress: 57.39%
Download in progress: 57.41%
Download in progress: 57.43%
Download in progress: 57.44%
Download in progress: 57.46%
Download in progress: 57.48%
Download in progress: 57.50%
Download in progress: 57.51%
Download in progress: 57.53%
Download in progress: 57.55%
Download in progress: 57.57%
Download in progress: 57.58%
Download in progress: 57.60%
Download in progress: 57.62%
Download in progress: 57.64%
Download in progress: 57.65%
Download in progress: 57.67%
Download in progress: 57.69%
Download in progress: 57.71%
Download in progress: 57.72%
Download in progress: 57.74%
Download in progress: 57.76%
Download in progress: 57.78%
Download in progress: 57.79%
Download in progress: 57.81%
Download in progress: 57.83%
Download in progress: 57.85%
Download in progress: 57.86%
Download in progress: 57.88%
Download in progress: 57.90%
Download in progress: 57.92%
Download in progress: 57.93%
Download in progress: 57.95%
Download in progress: 57.97%
Download in progress: 57.99%
Download in progress: 58.00%
Download in progress: 58.02%
Download in progress: 58.04%
Download in progress: 58.06%
Download in progress: 58.07%
Download in progress: 58.09%
Download in progress: 58.11%
Download in progress: 58.13%
Download in progress: 58.14%
Download in progress: 58.16%
Download in progress: 58.18%
Download in progress: 58.20%
Download in progress: 58.21%
Download in progress: 58.23%
Download in progress: 58.25%
Download in progress: 58.27%
Download in progress: 58.28%
Download in progress: 58.30%
Download in progress: 58.32%
Download in progress: 58.34%
Download in progress: 58.35%
Download in progress: 58.37%
Download in progress: 58.39%
Download in progress: 58.41%
Download in progress: 58.42%
Download in progress: 58.44%
Download in progress: 58.46%
Download in progress: 58.48%
Download in progress: 58.49%
Download in progress: 58.51%
Download in progress: 58.53%
Download in progress: 58.55%
Download in progress: 58.56%
Download in progress: 58.58%
Download in progress: 58.60%
Download in progress: 58.62%
Download in progress: 58.63%
Download in progress: 58.65%
Download in progress: 58.67%
Download in progress: 58.69%
Download in progress: 58.70%
Download in progress: 58.72%
Download in progress: 58.74%
Download in progress: 58.76%
Download in progress: 58.77%
Download in progress: 58.79%
Download in progress: 58.81%
Download in progress: 58.83%
Download in progress: 58.84%
Download in progress: 58.86%
Download in progress: 58.88%
Download in progress: 58.90%
Download in progress: 58.91%
Download in progress: 58.93%
Download in progress: 58.95%
Download in progress: 58.97%
Download in progress: 58.98%
Download in progress: 59.00%
Download in progress: 59.02%
Download in progress: 59.04%
Download in progress: 59.05%
Download in progress: 59.07%
Download in progress: 59.09%
Download in progress: 59.11%
Download in progress: 59.12%
Download in progress: 59.14%
Download in progress: 59.16%
Download in progress: 59.17%
Download in progress: 59.19%
Download in progress: 59.21%
Download in progress: 59.23%
Download in progress: 59.24%
Download in progress: 59.26%
Download in progress: 59.28%
Download in progress: 59.30%
Download in progress: 59.31%
Download in progress: 59.33%
Download in progress: 59.35%
Download in progress: 59.37%
Download in progress: 59.38%
Download in progress: 59.40%
Download in progress: 59.42%
Download in progress: 59.44%
Download in progress: 59.45%
Download in progress: 59.47%
Download in progress: 59.49%
Download in progress: 59.51%
Download in progress: 59.52%
Download in progress: 59.54%
Download in progress: 59.56%
Download in progress: 59.58%
Download in progress: 59.59%
Download in progress: 59.61%
Download in progress: 59.63%
Download in progress: 59.65%
Download in progress: 59.66%
Download in progress: 59.68%
Download in progress: 59.70%
Download in progress: 59.72%
Download in progress: 59.73%
Download in progress: 59.75%
Download in progress: 59.77%
Download in progress: 59.79%
Download in progress: 59.80%
Download in progress: 59.82%
Download in progress: 59.84%
Download in progress: 59.86%
Download in progress: 59.87%
Download in progress: 59.89%
Download in progress: 59.91%
Download in progress: 59.93%
Download in progress: 59.94%
Download in progress: 59.96%
Download in progress: 59.98%
Download in progress: 60.00%
Download in progress: 60.01%
Download in progress: 60.03%
Download in progress: 60.05%
Download in progress: 60.07%
Download in progress: 60.08%
Download in progress: 60.10%
Download in progress: 60.12%
Download in progress: 60.14%
Download in progress: 60.15%
Download in progress: 60.17%
Download in progress: 60.19%
Download in progress: 60.21%
Download in progress: 60.22%
Download in progress: 60.24%
Download in progress: 60.26%
Download in progress: 60.28%
Download in progress: 60.29%
Download in progress: 60.31%
Download in progress: 60.33%
Download in progress: 60.35%
Download in progress: 60.36%
Download in progress: 60.38%
Download in progress: 60.40%
Download in progress: 60.42%
Download in progress: 60.43%
Download in progress: 60.45%
Download in progress: 60.47%
Download in progress: 60.49%
Download in progress: 60.50%
Download in progress: 60.52%
Download in progress: 60.54%
Download in progress: 60.56%
Download in progress: 60.57%
Download in progress: 60.59%
Download in progress: 60.61%
Download in progress: 60.63%
Download in progress: 60.64%
Download in progress: 60.66%
Download in progress: 60.68%
Download in progress: 60.70%
Download in progress: 60.71%
Download in progress: 60.73%
Download in progress: 60.75%
Download in progress: 60.77%
Download in progress: 60.78%
Download in progress: 60.80%
Download in progress: 60.82%
Download in progress: 60.84%
Download in progress: 60.85%
Download in progress: 60.87%
Download in progress: 60.89%
Download in progress: 60.91%
Download in progress: 60.92%
Download in progress: 60.94%
Download in progress: 60.96%
Download in progress: 60.98%
Download in progress: 60.99%
Download in progress: 61.01%
Download in progress: 61.03%
Download in progress: 61.05%
Download in progress: 61.06%
Download in progress: 61.08%
Download in progress: 61.10%
Download in progress: 61.12%
Download in progress: 61.13%
Download in progress: 61.15%
Download in progress: 61.17%
Download in progress: 61.19%
Download in progress: 61.20%
Download in progress: 61.22%
Download in progress: 61.24%
Download in progress: 61.26%
Download in progress: 61.27%
Download in progress: 61.29%
Download in progress: 61.31%
Download in progress: 61.33%
Download in progress: 61.34%
Download in progress: 61.36%
Download in progress: 61.38%
Download in progress: 61.40%
Download in progress: 61.41%
Download in progress: 61.43%
Download in progress: 61.45%
Download in progress: 61.47%
Download in progress: 61.48%
Download in progress: 61.50%
Download in progress: 61.52%
Download in progress: 61.53%
Download in progress: 61.55%
Download in progress: 61.57%
Download in progress: 61.59%
Download in progress: 61.60%
Download in progress: 61.62%
Download in progress: 61.64%
Download in progress: 61.66%
Download in progress: 61.67%
Download in progress: 61.69%
Download in progress: 61.71%
Download in progress: 61.73%
Download in progress: 61.74%
Download in progress: 61.76%
Download in progress: 61.78%
Download in progress: 61.80%
Download in progress: 61.81%
Download in progress: 61.83%
Download in progress: 61.85%
Download in progress: 61.87%
Download in progress: 61.88%
Download in progress: 61.90%
Download in progress: 61.92%
Download in progress: 61.94%
Download in progress: 61.95%
Download in progress: 61.97%
Download in progress: 61.99%
Download in progress: 62.01%
Download in progress: 62.02%
Download in progress: 62.04%
Download in progress: 62.06%
Download in progress: 62.08%
Download in progress: 62.09%
Download in progress: 62.11%
Download in progress: 62.13%
Download in progress: 62.15%
Download in progress: 62.16%
Download in progress: 62.18%
Download in progress: 62.20%
Download in progress: 62.22%
Download in progress: 62.23%
Download in progress: 62.25%
Download in progress: 62.27%
Download in progress: 62.29%
Download in progress: 62.30%
Download in progress: 62.32%
Download in progress: 62.34%
Download in progress: 62.36%
Download in progress: 62.37%
Download in progress: 62.39%
Download in progress: 62.41%
Download in progress: 62.43%
Download in progress: 62.44%
Download in progress: 62.46%
Download in progress: 62.48%
Download in progress: 62.50%
Download in progress: 62.51%
Download in progress: 62.53%
Download in progress: 62.55%
Download in progress: 62.57%
Download in progress: 62.58%
Download in progress: 62.60%
Download in progress: 62.62%
Download in progress: 62.64%
Download in progress: 62.65%
Download in progress: 62.67%
Download in progress: 62.69%
Download in progress: 62.71%
Download in progress: 62.72%
Download in progress: 62.74%
Download in progress: 62.76%
Download in progress: 62.78%
Download in progress: 62.79%
Download in progress: 62.81%
Download in progress: 62.83%
Download in progress: 62.85%
Download in progress: 62.86%
Download in progress: 62.88%
Download in progress: 62.90%
Download in progress: 62.92%
Download in progress: 62.93%
Download in progress: 62.95%
Download in progress: 62.97%
Download in progress: 62.99%
Download in progress: 63.00%
Download in progress: 63.02%
Download in progress: 63.04%
Download in progress: 63.06%
Download in progress: 63.07%
Download in progress: 63.09%
Download in progress: 63.11%
Download in progress: 63.13%
Download in progress: 63.14%
Download in progress: 63.16%
Download in progress: 63.18%
Download in progress: 63.20%
Download in progress: 63.21%
Download in progress: 63.23%
Download in progress: 63.25%
Download in progress: 63.27%
Download in progress: 63.28%
Download in progress: 63.30%
Download in progress: 63.32%
Download in progress: 63.34%
Download in progress: 63.35%
Download in progress: 63.37%
Download in progress: 63.39%
Download in progress: 63.41%
Download in progress: 63.42%
Download in progress: 63.44%
Download in progress: 63.46%
Download in progress: 63.48%
Download in progress: 63.49%
Download in progress: 63.51%
Download in progress: 63.53%
Download in progress: 63.55%
Download in progress: 63.56%
Download in progress: 63.58%
Download in progress: 63.60%
Download in progress: 63.62%
Download in progress: 63.63%
Download in progress: 63.65%
Download in progress: 63.67%
Download in progress: 63.69%
Download in progress: 63.70%
Download in progress: 63.72%
Download in progress: 63.74%
Download in progress: 63.76%
Download in progress: 63.77%
Download in progress: 63.79%
Download in progress: 63.81%
Download in progress: 63.83%
Download in progress: 63.84%
Download in progress: 63.86%
Download in progress: 63.88%
Download in progress: 63.89%
Download in progress: 63.91%
Download in progress: 63.93%
Download in progress: 63.95%
Download in progress: 63.96%
Download in progress: 63.98%
Download in progress: 64.00%
Download in progress: 64.02%
Download in progress: 64.03%
Download in progress: 64.05%
Download in progress: 64.07%
Download in progress: 64.09%
Download in progress: 64.10%
Download in progress: 64.12%
Download in progress: 64.14%
Download in progress: 64.16%
Download in progress: 64.17%
Download in progress: 64.19%
Download in progress: 64.21%
Download in progress: 64.23%
Download in progress: 64.24%
Download in progress: 64.26%
Download in progress: 64.28%
Download in progress: 64.30%
Download in progress: 64.31%
Download in progress: 64.33%
Download in progress: 64.35%
Download in progress: 64.37%
Download in progress: 64.38%
Download in progress: 64.40%
Download in progress: 64.42%
Download in progress: 64.44%
Download in progress: 64.45%
Download in progress: 64.47%
Download in progress: 64.49%
Download in progress: 64.51%
Download in progress: 64.52%
Download in progress: 64.54%
Download in progress: 64.56%
Download in progress: 64.58%
Download in progress: 64.59%
Download in progress: 64.61%
Download in progress: 64.63%
Download in progress: 64.65%
Download in progress: 64.66%
Download in progress: 64.68%
Download in progress: 64.70%
Download in progress: 64.72%
Download in progress: 64.73%
Download in progress: 64.75%
Download in progress: 64.77%
Download in progress: 64.79%
Download in progress: 64.80%
Download in progress: 64.82%
Download in progress: 64.84%
Download in progress: 64.86%
Download in progress: 64.87%
Download in progress: 64.89%
Download in progress: 64.91%
Download in progress: 64.93%
Download in progress: 64.94%
Download in progress: 64.96%
Download in progress: 64.98%
Download in progress: 65.00%
Download in progress: 65.01%
Download in progress: 65.03%
Download in progress: 65.05%
Download in progress: 65.07%
Download in progress: 65.08%
Download in progress: 65.10%
Download in progress: 65.12%
Download in progress: 65.14%
Download in progress: 65.15%
Download in progress: 65.17%
Download in progress: 65.19%
Download in progress: 65.21%
Download in progress: 65.22%
Download in progress: 65.24%
Download in progress: 65.26%
Download in progress: 65.28%
Download in progress: 65.29%
Download in progress: 65.31%
Download in progress: 65.33%
Download in progress: 65.35%
Download in progress: 65.36%
Download in progress: 65.38%
Download in progress: 65.40%
Download in progress: 65.42%
Download in progress: 65.43%
Download in progress: 65.45%
Download in progress: 65.47%
Download in progress: 65.49%
Download in progress: 65.50%
Download in progress: 65.52%
Download in progress: 65.54%
Download in progress: 65.56%
Download in progress: 65.57%
Download in progress: 65.59%
Download in progress: 65.61%
Download in progress: 65.63%
Download in progress: 65.64%
Download in progress: 65.66%
Download in progress: 65.68%
Download in progress: 65.70%
Download in progress: 65.71%
Download in progress: 65.73%
Download in progress: 65.75%
Download in progress: 65.77%
Download in progress: 65.78%
Download in progress: 65.80%
Download in progress: 65.82%
Download in progress: 65.84%
Download in progress: 65.85%
Download in progress: 65.87%
Download in progress: 65.89%
Download in progress: 65.91%
Download in progress: 65.92%
Download in progress: 65.94%
Download in progress: 65.96%
Download in progress: 65.98%
Download in progress: 65.99%
Download in progress: 66.01%
Download in progress: 66.03%
Download in progress: 66.05%
Download in progress: 66.06%
Download in progress: 66.08%
Download in progress: 66.10%
Download in progress: 66.12%
Download in progress: 66.13%
Download in progress: 66.15%
Download in progress: 66.17%
Download in progress: 66.19%
Download in progress: 66.20%
Download in progress: 66.22%
Download in progress: 66.24%
Download in progress: 66.25%
Download in progress: 66.27%
Download in progress: 66.29%
Download in progress: 66.31%
Download in progress: 66.32%
Download in progress: 66.34%
Download in progress: 66.36%
Download in progress: 66.38%
Download in progress: 66.39%
Download in progress: 66.41%
Download in progress: 66.43%
Download in progress: 66.45%
Download in progress: 66.46%
Download in progress: 66.48%
Download in progress: 66.50%
Download in progress: 66.52%
Download in progress: 66.53%
Download in progress: 66.55%
Download in progress: 66.57%
Download in progress: 66.59%
Download in progress: 66.60%
Download in progress: 66.62%
Download in progress: 66.64%
Download in progress: 66.66%
Download in progress: 66.67%
Download in progress: 66.69%
Download in progress: 66.71%
Download in progress: 66.73%
Download in progress: 66.74%
Download in progress: 66.76%
Download in progress: 66.78%
Download in progress: 66.80%
Download in progress: 66.81%
Download in progress: 66.83%
Download in progress: 66.85%
Download in progress: 66.87%
Download in progress: 66.88%
Download in progress: 66.90%
Download in progress: 66.92%
Download in progress: 66.94%
Download in progress: 66.95%
Download in progress: 66.97%
Download in progress: 66.99%
Download in progress: 67.01%
Download in progress: 67.02%
Download in progress: 67.04%
Download in progress: 67.06%
Download in progress: 67.08%
Download in progress: 67.09%
Download in progress: 67.11%
Download in progress: 67.13%
Download in progress: 67.15%
Download in progress: 67.16%
Download in progress: 67.18%
Download in progress: 67.20%
Download in progress: 67.22%
Download in progress: 67.23%
Download in progress: 67.25%
Download in progress: 67.27%
Download in progress: 67.29%
Download in progress: 67.30%
Download in progress: 67.32%
Download in progress: 67.34%
Download in progress: 67.36%
Download in progress: 67.37%
Download in progress: 67.39%
Download in progress: 67.41%
Download in progress: 67.43%
Download in progress: 67.44%
Download in progress: 67.46%
Download in progress: 67.48%
Download in progress: 67.50%
Download in progress: 67.51%
Download in progress: 67.53%
Download in progress: 67.55%
Download in progress: 67.57%
Download in progress: 67.58%
Download in progress: 67.60%
Download in progress: 67.62%
Download in progress: 67.64%
Download in progress: 67.65%
Download in progress: 67.67%
Download in progress: 67.69%
Download in progress: 67.71%
Download in progress: 67.72%
Download in progress: 67.74%
Download in progress: 67.76%
Download in progress: 67.78%
Download in progress: 67.79%
Download in progress: 67.81%
Download in progress: 67.83%
Download in progress: 67.85%
Download in progress: 67.86%
Download in progress: 67.88%
Download in progress: 67.90%
Download in progress: 67.92%
Download in progress: 67.93%
Download in progress: 67.95%
Download in progress: 67.97%
Download in progress: 67.99%
Download in progress: 68.00%
Download in progress: 68.02%
Download in progress: 68.04%
Download in progress: 68.06%
Download in progress: 68.07%
Download in progress: 68.09%
Download in progress: 68.11%
Download in progress: 68.13%
Download in progress: 68.14%
Download in progress: 68.16%
Download in progress: 68.18%
Download in progress: 68.20%
Download in progress: 68.21%
Download in progress: 68.23%
Download in progress: 68.25%
Download in progress: 68.27%
Download in progress: 68.28%
Download in progress: 68.30%
Download in progress: 68.32%
Download in progress: 68.34%
Download in progress: 68.35%
Download in progress: 68.37%
Download in progress: 68.39%
Download in progress: 68.41%
Download in progress: 68.42%
Download in progress: 68.44%
Download in progress: 68.46%
Download in progress: 68.48%
Download in progress: 68.49%
Download in progress: 68.51%
Download in progress: 68.53%
Download in progress: 68.55%
Download in progress: 68.56%
Download in progress: 68.58%
Download in progress: 68.60%
Download in progress: 68.62%
Download in progress: 68.63%
Download in progress: 68.65%
Download in progress: 68.67%
Download in progress: 68.68%
Download in progress: 68.70%
Download in progress: 68.72%
Download in progress: 68.74%
Download in progress: 68.75%
Download in progress: 68.77%
Download in progress: 68.79%
Download in progress: 68.81%
Download in progress: 68.82%
Download in progress: 68.84%
Download in progress: 68.86%
Download in progress: 68.88%
Download in progress: 68.89%
Download in progress: 68.91%
Download in progress: 68.93%
Download in progress: 68.95%
Download in progress: 68.96%
Download in progress: 68.98%
Download in progress: 69.00%
Download in progress: 69.02%
Download in progress: 69.03%
Download in progress: 69.05%
Download in progress: 69.07%
Download in progress: 69.09%
Download in progress: 69.10%
Download in progress: 69.12%
Download in progress: 69.14%
Download in progress: 69.16%
Download in progress: 69.17%
Download in progress: 69.19%
Download in progress: 69.21%
Download in progress: 69.23%
Download in progress: 69.24%
Download in progress: 69.26%
Download in progress: 69.28%
Download in progress: 69.30%
Download in progress: 69.31%
Download in progress: 69.33%
Download in progress: 69.35%
Download in progress: 69.37%
Download in progress: 69.38%
Download in progress: 69.40%
Download in progress: 69.42%
Download in progress: 69.44%
Download in progress: 69.45%
Download in progress: 69.47%
Download in progress: 69.49%
Download in progress: 69.51%
Download in progress: 69.52%
Download in progress: 69.54%
Download in progress: 69.56%
Download in progress: 69.58%
Download in progress: 69.59%
Download in progress: 69.61%
Download in progress: 69.63%
Download in progress: 69.65%
Download in progress: 69.66%
Download in progress: 69.68%
Download in progress: 69.70%
Download in progress: 69.72%
Download in progress: 69.73%
Download in progress: 69.75%
Download in progress: 69.77%
Download in progress: 69.79%
Download in progress: 69.80%
Download in progress: 69.82%
Download in progress: 69.84%
Download in progress: 69.86%
Download in progress: 69.87%
Download in progress: 69.89%
Download in progress: 69.91%
Download in progress: 69.93%
Download in progress: 69.94%
Download in progress: 69.96%
Download in progress: 69.98%
Download in progress: 70.00%
Download in progress: 70.01%
Download in progress: 70.03%
Download in progress: 70.05%
Download in progress: 70.07%
Download in progress: 70.08%
Download in progress: 70.10%
Download in progress: 70.12%
Download in progress: 70.14%
Download in progress: 70.15%
Download in progress: 70.17%
Download in progress: 70.19%
Download in progress: 70.21%
Download in progress: 70.22%
Download in progress: 70.24%
Download in progress: 70.26%
Download in progress: 70.28%
Download in progress: 70.29%
Download in progress: 70.31%
Download in progress: 70.33%
Download in progress: 70.35%
Download in progress: 70.36%
Download in progress: 70.38%
Download in progress: 70.40%
Download in progress: 70.42%
Download in progress: 70.43%
Download in progress: 70.45%
Download in progress: 70.47%
Download in progress: 70.49%
Download in progress: 70.50%
Download in progress: 70.52%
Download in progress: 70.54%
Download in progress: 70.56%
Download in progress: 70.57%
Download in progress: 70.59%
Download in progress: 70.61%
Download in progress: 70.63%
Download in progress: 70.64%
Download in progress: 70.66%
Download in progress: 70.68%
Download in progress: 70.70%
Download in progress: 70.71%
Download in progress: 70.73%
Download in progress: 70.75%
Download in progress: 70.77%
Download in progress: 70.78%
Download in progress: 70.80%
Download in progress: 70.82%
Download in progress: 70.84%
Download in progress: 70.85%
Download in progress: 70.87%
Download in progress: 70.89%
Download in progress: 70.91%
Download in progress: 70.92%
Download in progress: 70.94%
Download in progress: 70.96%
Download in progress: 70.98%
Download in progress: 70.99%
Download in progress: 71.01%
Download in progress: 71.03%
Download in progress: 71.04%
Download in progress: 71.06%
Download in progress: 71.08%
Download in progress: 71.10%
Download in progress: 71.11%
Download in progress: 71.13%
Download in progress: 71.15%
Download in progress: 71.17%
Download in progress: 71.18%
Download in progress: 71.20%
Download in progress: 71.22%
Download in progress: 71.24%
Download in progress: 71.25%
Download in progress: 71.27%
Download in progress: 71.29%
Download in progress: 71.31%
Download in progress: 71.32%
Download in progress: 71.34%
Download in progress: 71.36%
Download in progress: 71.38%
Download in progress: 71.39%
Download in progress: 71.41%
Download in progress: 71.43%
Download in progress: 71.45%
Download in progress: 71.46%
Download in progress: 71.48%
Download in progress: 71.50%
Download in progress: 71.52%
Download in progress: 71.53%
Download in progress: 71.55%
Download in progress: 71.57%
Download in progress: 71.59%
Download in progress: 71.60%
Download in progress: 71.62%
Download in progress: 71.64%
Download in progress: 71.66%
Download in progress: 71.67%
Download in progress: 71.69%
Download in progress: 71.71%
Download in progress: 71.73%
Download in progress: 71.74%
Download in progress: 71.76%
Download in progress: 71.78%
Download in progress: 71.80%
Download in progress: 71.81%
Download in progress: 71.83%
Download in progress: 71.85%
Download in progress: 71.87%
Download in progress: 71.88%
Download in progress: 71.90%
Download in progress: 71.92%
Download in progress: 71.94%
Download in progress: 71.95%
Download in progress: 71.97%
Download in progress: 71.99%
Download in progress: 72.01%
Download in progress: 72.02%
Download in progress: 72.04%
Download in progress: 72.06%
Download in progress: 72.08%
Download in progress: 72.09%
Download in progress: 72.11%
Download in progress: 72.13%
Download in progress: 72.15%
Download in progress: 72.16%
Download in progress: 72.18%
Download in progress: 72.20%
Download in progress: 72.22%
Download in progress: 72.23%
Download in progress: 72.25%
Download in progress: 72.27%
Download in progress: 72.29%
Download in progress: 72.30%
Download in progress: 72.32%
Download in progress: 72.34%
Download in progress: 72.36%
Download in progress: 72.37%
Download in progress: 72.39%
Download in progress: 72.41%
Download in progress: 72.43%
Download in progress: 72.44%
Download in progress: 72.46%
Download in progress: 72.48%
Download in progress: 72.50%
Download in progress: 72.51%
Download in progress: 72.53%
Download in progress: 72.55%
Download in progress: 72.57%
Download in progress: 72.58%
Download in progress: 72.60%
Download in progress: 72.62%
Download in progress: 72.64%
Download in progress: 72.65%
Download in progress: 72.67%
Download in progress: 72.69%
Download in progress: 72.71%
Download in progress: 72.72%
Download in progress: 72.74%
Download in progress: 72.76%
Download in progress: 72.78%
Download in progress: 72.79%
Download in progress: 72.81%
Download in progress: 72.83%
Download in progress: 72.85%
Download in progress: 72.86%
Download in progress: 72.88%
Download in progress: 72.90%
Download in progress: 72.92%
Download in progress: 72.93%
Download in progress: 72.95%
Download in progress: 72.97%
Download in progress: 72.99%
Download in progress: 73.00%
Download in progress: 73.02%
Download in progress: 73.04%
Download in progress: 73.06%
Download in progress: 73.07%
Download in progress: 73.09%
Download in progress: 73.11%
Download in progress: 73.13%
Download in progress: 73.14%
Download in progress: 73.16%
Download in progress: 73.18%
Download in progress: 73.20%
Download in progress: 73.21%
Download in progress: 73.23%
Download in progress: 73.25%
Download in progress: 73.27%
Download in progress: 73.28%
Download in progress: 73.30%
Download in progress: 73.32%
Download in progress: 73.34%
Download in progress: 73.35%
Download in progress: 73.37%
Download in progress: 73.39%
Download in progress: 73.40%
Download in progress: 73.42%
Download in progress: 73.44%
Download in progress: 73.46%
Download in progress: 73.47%
Download in progress: 73.49%
Download in progress: 73.51%
Download in progress: 73.53%
Download in progress: 73.54%
Download in progress: 73.56%
Download in progress: 73.58%
Download in progress: 73.60%
Download in progress: 73.61%
Download in progress: 73.63%
Download in progress: 73.65%
Download in progress: 73.67%
Download in progress: 73.68%
Download in progress: 73.70%
Download in progress: 73.72%
Download in progress: 73.74%
Download in progress: 73.75%
Download in progress: 73.77%
Download in progress: 73.79%
Download in progress: 73.81%
Download in progress: 73.82%
Download in progress: 73.84%
Download in progress: 73.86%
Download in progress: 73.88%
Download in progress: 73.89%
Download in progress: 73.91%
Download in progress: 73.93%
Download in progress: 73.95%
Download in progress: 73.96%
Download in progress: 73.98%
Download in progress: 74.00%
Download in progress: 74.02%
Download in progress: 74.03%
Download in progress: 74.05%
Download in progress: 74.07%
Download in progress: 74.09%
Download in progress: 74.10%
Download in progress: 74.12%
Download in progress: 74.14%
Download in progress: 74.16%
Download in progress: 74.17%
Download in progress: 74.19%
Download in progress: 74.21%
Download in progress: 74.23%
Download in progress: 74.24%
Download in progress: 74.26%
Download in progress: 74.28%
Download in progress: 74.30%
Download in progress: 74.31%
Download in progress: 74.33%
Download in progress: 74.35%
Download in progress: 74.37%
Download in progress: 74.38%
Download in progress: 74.40%
Download in progress: 74.42%
Download in progress: 74.44%
Download in progress: 74.45%
Download in progress: 74.47%
Download in progress: 74.49%
Download in progress: 74.51%
Download in progress: 74.52%
Download in progress: 74.54%
Download in progress: 74.56%
Download in progress: 74.58%
Download in progress: 74.59%
Download in progress: 74.61%
Download in progress: 74.63%
Download in progress: 74.65%
Download in progress: 74.66%
Download in progress: 74.68%
Download in progress: 74.70%
Download in progress: 74.72%
Download in progress: 74.73%
Download in progress: 74.75%
Download in progress: 74.77%
Download in progress: 74.79%
Download in progress: 74.80%
Download in progress: 74.82%
Download in progress: 74.84%
Download in progress: 74.86%
Download in progress: 74.87%
Download in progress: 74.89%
Download in progress: 74.91%
Download in progress: 74.93%
Download in progress: 74.94%
Download in progress: 74.96%
Download in progress: 74.98%
Download in progress: 75.00%
Download in progress: 75.01%
Download in progress: 75.03%
Download in progress: 75.05%
Download in progress: 75.07%
Download in progress: 75.08%
Download in progress: 75.10%
Download in progress: 75.12%
Download in progress: 75.14%
Download in progress: 75.15%
Download in progress: 75.17%
Download in progress: 75.19%
Download in progress: 75.21%
Download in progress: 75.22%
Download in progress: 75.24%
Download in progress: 75.26%
Download in progress: 75.28%
Download in progress: 75.29%
Download in progress: 75.31%
Download in progress: 75.33%
Download in progress: 75.35%
Download in progress: 75.36%
Download in progress: 75.38%
Download in progress: 75.40%
Download in progress: 75.42%
Download in progress: 75.43%
Download in progress: 75.45%
Download in progress: 75.47%
Download in progress: 75.49%
Download in progress: 75.50%
Download in progress: 75.52%
Download in progress: 75.54%
Download in progress: 75.56%
Download in progress: 75.57%
Download in progress: 75.59%
Download in progress: 75.61%
Download in progress: 75.63%
Download in progress: 75.64%
Download in progress: 75.66%
Download in progress: 75.68%
Download in progress: 75.70%
Download in progress: 75.71%
Download in progress: 75.73%
Download in progress: 75.75%
Download in progress: 75.76%
Download in progress: 75.78%
Download in progress: 75.80%
Download in progress: 75.82%
Download in progress: 75.83%
Download in progress: 75.85%
Download in progress: 75.87%
Download in progress: 75.89%
Download in progress: 75.90%
Download in progress: 75.92%
Download in progress: 75.94%
Download in progress: 75.96%
Download in progress: 75.97%
Download in progress: 75.99%
Download in progress: 76.01%
Download in progress: 76.03%
Download in progress: 76.04%
Download in progress: 76.06%
Download in progress: 76.08%
Download in progress: 76.10%
Download in progress: 76.11%
Download in progress: 76.13%
Download in progress: 76.15%
Download in progress: 76.17%
Download in progress: 76.18%
Download in progress: 76.20%
Download in progress: 76.22%
Download in progress: 76.24%
Download in progress: 76.25%
Download in progress: 76.27%
Download in progress: 76.29%
Download in progress: 76.31%
Download in progress: 76.32%
Download in progress: 76.34%
Download in progress: 76.36%
Download in progress: 76.38%
Download in progress: 76.39%
Download in progress: 76.41%
Download in progress: 76.43%
Download in progress: 76.45%
Download in progress: 76.46%
Download in progress: 76.48%
Download in progress: 76.50%
Download in progress: 76.52%
Download in progress: 76.53%
Download in progress: 76.55%
Download in progress: 76.57%
Download in progress: 76.59%
Download in progress: 76.60%
Download in progress: 76.62%
Download in progress: 76.64%
Download in progress: 76.66%
Download in progress: 76.67%
Download in progress: 76.69%
Download in progress: 76.71%
Download in progress: 76.73%
Download in progress: 76.74%
Download in progress: 76.76%
Download in progress: 76.78%
Download in progress: 76.80%
Download in progress: 76.81%
Download in progress: 76.83%
Download in progress: 76.85%
Download in progress: 76.87%
Download in progress: 76.88%
Download in progress: 76.90%
Download in progress: 76.92%
Download in progress: 76.94%
Download in progress: 76.95%
Download in progress: 76.97%
Download in progress: 76.99%
Download in progress: 77.01%
Download in progress: 77.02%
Download in progress: 77.04%
Download in progress: 77.06%
Download in progress: 77.08%
Download in progress: 77.09%
Download in progress: 77.11%
Download in progress: 77.13%
Download in progress: 77.15%
Download in progress: 77.16%
Download in progress: 77.18%
Download in progress: 77.20%
Download in progress: 77.22%
Download in progress: 77.23%
Download in progress: 77.25%
Download in progress: 77.27%
Download in progress: 77.29%
Download in progress: 77.30%
Download in progress: 77.32%
Download in progress: 77.34%
Download in progress: 77.36%
Download in progress: 77.37%
Download in progress: 77.39%
Download in progress: 77.41%
Download in progress: 77.43%
Download in progress: 77.44%
Download in progress: 77.46%
Download in progress: 77.48%
Download in progress: 77.50%
Download in progress: 77.51%
Download in progress: 77.53%
Download in progress: 77.55%
Download in progress: 77.57%
Download in progress: 77.58%
Download in progress: 77.60%
Download in progress: 77.62%
Download in progress: 77.64%
Download in progress: 77.65%
Download in progress: 77.67%
Download in progress: 77.69%
Download in progress: 77.71%
Download in progress: 77.72%
Download in progress: 77.74%
Download in progress: 77.76%
Download in progress: 77.78%
Download in progress: 77.79%
Download in progress: 77.81%
Download in progress: 77.83%
Download in progress: 77.85%
Download in progress: 77.86%
Download in progress: 77.88%
Download in progress: 77.90%
Download in progress: 77.92%
Download in progress: 77.93%
Download in progress: 77.95%
Download in progress: 77.97%
Download in progress: 77.99%
Download in progress: 78.00%
Download in progress: 78.02%
Download in progress: 78.04%
Download in progress: 78.06%
Download in progress: 78.07%
Download in progress: 78.09%
Download in progress: 78.11%
Download in progress: 78.12%
Download in progress: 78.14%
Download in progress: 78.16%
Download in progress: 78.18%
Download in progress: 78.19%
Download in progress: 78.21%
Download in progress: 78.23%
Download in progress: 78.25%
Download in progress: 78.26%
Download in progress: 78.28%
Download in progress: 78.30%
Download in progress: 78.32%
Download in progress: 78.33%
Download in progress: 78.35%
Download in progress: 78.37%
Download in progress: 78.39%
Download in progress: 78.40%
Download in progress: 78.42%
Download in progress: 78.44%
Download in progress: 78.46%
Download in progress: 78.47%
Download in progress: 78.49%
Download in progress: 78.51%
Download in progress: 78.53%
Download in progress: 78.54%
Download in progress: 78.56%
Download in progress: 78.58%
Download in progress: 78.60%
Download in progress: 78.61%
Download in progress: 78.63%
Download in progress: 78.65%
Download in progress: 78.67%
Download in progress: 78.68%
Download in progress: 78.70%
Download in progress: 78.72%
Download in progress: 78.74%
Download in progress: 78.75%
Download in progress: 78.77%
Download in progress: 78.79%
Download in progress: 78.81%
Download in progress: 78.82%
Download in progress: 78.84%
Download in progress: 78.86%
Download in progress: 78.88%
Download in progress: 78.89%
Download in progress: 78.91%
Download in progress: 78.93%
Download in progress: 78.95%
Download in progress: 78.96%
Download in progress: 78.98%
Download in progress: 79.00%
Download in progress: 79.02%
Download in progress: 79.03%
Download in progress: 79.05%
Download in progress: 79.07%
Download in progress: 79.09%
Download in progress: 79.10%
Download in progress: 79.12%
Download in progress: 79.14%
Download in progress: 79.16%
Download in progress: 79.17%
Download in progress: 79.19%
Download in progress: 79.21%
Download in progress: 79.23%
Download in progress: 79.24%
Download in progress: 79.26%
Download in progress: 79.28%
Download in progress: 79.30%
Download in progress: 79.31%
Download in progress: 79.33%
Download in progress: 79.35%
Download in progress: 79.37%
Download in progress: 79.38%
Download in progress: 79.40%
Download in progress: 79.42%
Download in progress: 79.44%
Download in progress: 79.45%
Download in progress: 79.47%
Download in progress: 79.49%
Download in progress: 79.51%
Download in progress: 79.52%
Download in progress: 79.54%
Download in progress: 79.56%
Download in progress: 79.58%
Download in progress: 79.59%
Download in progress: 79.61%
Download in progress: 79.63%
Download in progress: 79.65%
Download in progress: 79.66%
Download in progress: 79.68%
Download in progress: 79.70%
Download in progress: 79.72%
Download in progress: 79.73%
Download in progress: 79.75%
Download in progress: 79.77%
Download in progress: 79.79%
Download in progress: 79.80%
Download in progress: 79.82%
Download in progress: 79.84%
Download in progress: 79.86%
Download in progress: 79.87%
Download in progress: 79.89%
Download in progress: 79.91%
Download in progress: 79.93%
Download in progress: 79.94%
Download in progress: 79.96%
Download in progress: 79.98%
Download in progress: 80.00%
Download in progress: 80.01%
Download in progress: 80.03%
Download in progress: 80.05%
Download in progress: 80.07%
Download in progress: 80.08%
Download in progress: 80.10%
Download in progress: 80.12%
Download in progress: 80.14%
Download in progress: 80.15%
Download in progress: 80.17%
Download in progress: 80.19%
Download in progress: 80.21%
Download in progress: 80.22%
Download in progress: 80.24%
Download in progress: 80.26%
Download in progress: 80.28%
Download in progress: 80.29%
Download in progress: 80.31%
Download in progress: 80.33%
Download in progress: 80.35%
Download in progress: 80.36%
Download in progress: 80.38%
Download in progress: 80.40%
Download in progress: 80.42%
Download in progress: 80.43%
Download in progress: 80.45%
Download in progress: 80.47%
Download in progress: 80.48%
Download in progress: 80.50%
Download in progress: 80.52%
Download in progress: 80.54%
Download in progress: 80.55%
Download in progress: 80.57%
Download in progress: 80.59%
Download in progress: 80.61%
Download in progress: 80.62%
Download in progress: 80.64%
Download in progress: 80.66%
Download in progress: 80.68%
Download in progress: 80.69%
Download in progress: 80.71%
Download in progress: 80.73%
Download in progress: 80.75%
Download in progress: 80.76%
Download in progress: 80.78%
Download in progress: 80.80%
Download in progress: 80.82%
Download in progress: 80.83%
Download in progress: 80.85%
Download in progress: 80.87%
Download in progress: 80.89%
Download in progress: 80.90%
Download in progress: 80.92%
Download in progress: 80.94%
Download in progress: 80.96%
Download in progress: 80.97%
Download in progress: 80.99%
Download in progress: 81.01%
Download in progress: 81.03%
Download in progress: 81.04%
Download in progress: 81.06%
Download in progress: 81.08%
Download in progress: 81.10%
Download in progress: 81.11%
Download in progress: 81.13%
Download in progress: 81.15%
Download in progress: 81.17%
Download in progress: 81.18%
Download in progress: 81.20%
Download in progress: 81.22%
Download in progress: 81.24%
Download in progress: 81.25%
Download in progress: 81.27%
Download in progress: 81.29%
Download in progress: 81.31%
Download in progress: 81.32%
Download in progress: 81.34%
Download in progress: 81.36%
Download in progress: 81.38%
Download in progress: 81.39%
Download in progress: 81.41%
Download in progress: 81.43%
Download in progress: 81.45%
Download in progress: 81.46%
Download in progress: 81.48%
Download in progress: 81.50%
Download in progress: 81.52%
Download in progress: 81.53%
Download in progress: 81.55%
Download in progress: 81.57%
Download in progress: 81.59%
Download in progress: 81.60%
Download in progress: 81.62%
Download in progress: 81.64%
Download in progress: 81.66%
Download in progress: 81.67%
Download in progress: 81.69%
Download in progress: 81.71%
Download in progress: 81.73%
Download in progress: 81.74%
Download in progress: 81.76%
Download in progress: 81.78%
Download in progress: 81.80%
Download in progress: 81.81%
Download in progress: 81.83%
Download in progress: 81.85%
Download in progress: 81.87%
Download in progress: 81.88%
Download in progress: 81.90%
Download in progress: 81.92%
Download in progress: 81.94%
Download in progress: 81.95%
Download in progress: 81.97%
Download in progress: 81.99%
Download in progress: 82.01%
Download in progress: 82.02%
Download in progress: 82.04%
Download in progress: 82.06%
Download in progress: 82.08%
Download in progress: 82.09%
Download in progress: 82.11%
Download in progress: 82.13%
Download in progress: 82.15%
Download in progress: 82.16%
Download in progress: 82.18%
Download in progress: 82.20%
Download in progress: 82.22%
Download in progress: 82.23%
Download in progress: 82.25%
Download in progress: 82.27%
Download in progress: 82.29%
Download in progress: 82.30%
Download in progress: 82.32%
Download in progress: 82.34%
Download in progress: 82.36%
Download in progress: 82.37%
Download in progress: 82.39%
Download in progress: 82.41%
Download in progress: 82.43%
Download in progress: 82.44%
Download in progress: 82.46%
Download in progress: 82.48%
Download in progress: 82.50%
Download in progress: 82.51%
Download in progress: 82.53%
Download in progress: 82.55%
Download in progress: 82.57%
Download in progress: 82.58%
Download in progress: 82.60%
Download in progress: 82.62%
Download in progress: 82.64%
Download in progress: 82.65%
Download in progress: 82.67%
Download in progress: 82.69%
Download in progress: 82.71%
Download in progress: 82.72%
Download in progress: 82.74%
Download in progress: 82.76%
Download in progress: 82.78%
Download in progress: 82.79%
Download in progress: 82.81%
Download in progress: 82.83%
Download in progress: 82.84%
Download in progress: 82.86%
Download in progress: 82.88%
Download in progress: 82.90%
Download in progress: 82.91%
Download in progress: 82.93%
Download in progress: 82.95%
Download in progress: 82.97%
Download in progress: 82.98%
Download in progress: 83.00%
Download in progress: 83.02%
Download in progress: 83.04%
Download in progress: 83.05%
Download in progress: 83.07%
Download in progress: 83.09%
Download in progress: 83.11%
Download in progress: 83.12%
Download in progress: 83.14%
Download in progress: 83.16%
Download in progress: 83.18%
Download in progress: 83.19%
Download in progress: 83.21%
Download in progress: 83.23%
Download in progress: 83.25%
Download in progress: 83.26%
Download in progress: 83.28%
Download in progress: 83.30%
Download in progress: 83.32%
Download in progress: 83.33%
Download in progress: 83.35%
Download in progress: 83.37%
Download in progress: 83.39%
Download in progress: 83.40%
Download in progress: 83.42%
Download in progress: 83.44%
Download in progress: 83.46%
Download in progress: 83.47%
Download in progress: 83.49%
Download in progress: 83.51%
Download in progress: 83.53%
Download in progress: 83.54%
Download in progress: 83.56%
Download in progress: 83.58%
Download in progress: 83.60%
Download in progress: 83.61%
Download in progress: 83.63%
Download in progress: 83.65%
Download in progress: 83.67%
Download in progress: 83.68%
Download in progress: 83.70%
Download in progress: 83.72%
Download in progress: 83.74%
Download in progress: 83.75%
Download in progress: 83.77%
Download in progress: 83.79%
Download in progress: 83.81%
Download in progress: 83.82%
Download in progress: 83.84%
Download in progress: 83.86%
Download in progress: 83.88%
Download in progress: 83.89%
Download in progress: 83.91%
Download in progress: 83.93%
Download in progress: 83.95%
Download in progress: 83.96%
Download in progress: 83.98%
Download in progress: 84.00%
Download in progress: 84.02%
Download in progress: 84.03%
Download in progress: 84.05%
Download in progress: 84.07%
Download in progress: 84.09%
Download in progress: 84.10%
Download in progress: 84.12%
Download in progress: 84.14%
Download in progress: 84.16%
Download in progress: 84.17%
Download in progress: 84.19%
Download in progress: 84.21%
Download in progress: 84.23%
Download in progress: 84.24%
Download in progress: 84.26%
Download in progress: 84.28%
Download in progress: 84.30%
Download in progress: 84.31%
Download in progress: 84.33%
Download in progress: 84.35%
Download in progress: 84.37%
Download in progress: 84.38%
Download in progress: 84.40%
Download in progress: 84.42%
Download in progress: 84.44%
Download in progress: 84.45%
Download in progress: 84.47%
Download in progress: 84.49%
Download in progress: 84.51%
Download in progress: 84.52%
Download in progress: 84.54%
Download in progress: 84.56%
Download in progress: 84.58%
Download in progress: 84.59%
Download in progress: 84.61%
Download in progress: 84.63%
Download in progress: 84.65%
Download in progress: 84.66%
Download in progress: 84.68%
Download in progress: 84.70%
Download in progress: 84.72%
Download in progress: 84.73%
Download in progress: 84.75%
Download in progress: 84.77%
Download in progress: 84.79%
Download in progress: 84.80%
Download in progress: 84.82%
Download in progress: 84.84%
Download in progress: 84.86%
Download in progress: 84.87%
Download in progress: 84.89%
Download in progress: 84.91%
Download in progress: 84.93%
Download in progress: 84.94%
Download in progress: 84.96%
Download in progress: 84.98%
Download in progress: 85.00%
Download in progress: 85.01%
Download in progress: 85.03%
Download in progress: 85.05%
Download in progress: 85.07%
Download in progress: 85.08%
Download in progress: 85.10%
Download in progress: 85.12%
Download in progress: 85.14%
Download in progress: 85.15%
Download in progress: 85.17%
Download in progress: 85.19%
Download in progress: 85.20%
Download in progress: 85.22%
Download in progress: 85.24%
Download in progress: 85.26%
Download in progress: 85.27%
Download in progress: 85.29%
Download in progress: 85.31%
Download in progress: 85.33%
Download in progress: 85.34%
Download in progress: 85.36%
Download in progress: 85.38%
Download in progress: 85.40%
Download in progress: 85.41%
Download in progress: 85.43%
Download in progress: 85.45%
Download in progress: 85.47%
Download in progress: 85.48%
Download in progress: 85.50%
Download in progress: 85.52%
Download in progress: 85.54%
Download in progress: 85.55%
Download in progress: 85.57%
Download in progress: 85.59%
Download in progress: 85.61%
Download in progress: 85.62%
Download in progress: 85.64%
Download in progress: 85.66%
Download in progress: 85.68%
Download in progress: 85.69%
Download in progress: 85.71%
Download in progress: 85.73%
Download in progress: 85.75%
Download in progress: 85.76%
Download in progress: 85.78%
Download in progress: 85.80%
Download in progress: 85.82%
Download in progress: 85.83%
Download in progress: 85.85%
Download in progress: 85.87%
Download in progress: 85.89%
Download in progress: 85.90%
Download in progress: 85.92%
Download in progress: 85.94%
Download in progress: 85.96%
Download in progress: 85.97%
Download in progress: 85.99%
Download in progress: 86.01%
Download in progress: 86.03%
Download in progress: 86.04%
Download in progress: 86.06%
Download in progress: 86.08%
Download in progress: 86.10%
Download in progress: 86.11%
Download in progress: 86.13%
Download in progress: 86.15%
Download in progress: 86.17%
Download in progress: 86.18%
Download in progress: 86.20%
Download in progress: 86.22%
Download in progress: 86.24%
Download in progress: 86.25%
Download in progress: 86.27%
Download in progress: 86.29%
Download in progress: 86.31%
Download in progress: 86.32%
Download in progress: 86.34%
Download in progress: 86.36%
Download in progress: 86.38%
Download in progress: 86.39%
Download in progress: 86.41%
Download in progress: 86.43%
Download in progress: 86.45%
Download in progress: 86.46%
Download in progress: 86.48%
Download in progress: 86.50%
Download in progress: 86.52%
Download in progress: 86.53%
Download in progress: 86.55%
Download in progress: 86.57%
Download in progress: 86.59%
Download in progress: 86.60%
Download in progress: 86.62%
Download in progress: 86.64%
Download in progress: 86.66%
Download in progress: 86.67%
Download in progress: 86.69%
Download in progress: 86.71%
Download in progress: 86.73%
Download in progress: 86.74%
Download in progress: 86.76%
Download in progress: 86.78%
Download in progress: 86.80%
Download in progress: 86.81%
Download in progress: 86.83%
Download in progress: 86.85%
Download in progress: 86.87%
Download in progress: 86.88%
Download in progress: 86.90%
Download in progress: 86.92%
Download in progress: 86.94%
Download in progress: 86.95%
Download in progress: 86.97%
Download in progress: 86.99%
Download in progress: 87.01%
Download in progress: 87.02%
Download in progress: 87.04%
Download in progress: 87.06%
Download in progress: 87.08%
Download in progress: 87.09%
Download in progress: 87.11%
Download in progress: 87.13%
Download in progress: 87.15%
Download in progress: 87.16%
Download in progress: 87.18%
Download in progress: 87.20%
Download in progress: 87.22%
Download in progress: 87.23%
Download in progress: 87.25%
Download in progress: 87.27%
Download in progress: 87.29%
Download in progress: 87.30%
Download in progress: 87.32%
Download in progress: 87.34%
Download in progress: 87.36%
Download in progress: 87.37%
Download in progress: 87.39%
Download in progress: 87.41%
Download in progress: 87.43%
Download in progress: 87.44%
Download in progress: 87.46%
Download in progress: 87.48%
Download in progress: 87.50%
Download in progress: 87.51%
Download in progress: 87.53%
Download in progress: 87.55%
Download in progress: 87.56%
Download in progress: 87.58%
Download in progress: 87.60%
Download in progress: 87.62%
Download in progress: 87.63%
Download in progress: 87.65%
Download in progress: 87.67%
Download in progress: 87.69%
Download in progress: 87.70%
Download in progress: 87.72%
Download in progress: 87.74%
Download in progress: 87.76%
Download in progress: 87.77%
Download in progress: 87.79%
Download in progress: 87.81%
Download in progress: 87.83%
Download in progress: 87.84%
Download in progress: 87.86%
Download in progress: 87.88%
Download in progress: 87.90%
Download in progress: 87.91%
Download in progress: 87.93%
Download in progress: 87.95%
Download in progress: 87.97%
Download in progress: 87.98%
Download in progress: 88.00%
Download in progress: 88.02%
Download in progress: 88.04%
Download in progress: 88.05%
Download in progress: 88.07%
Download in progress: 88.09%
Download in progress: 88.11%
Download in progress: 88.12%
Download in progress: 88.14%
Download in progress: 88.16%
Download in progress: 88.18%
Download in progress: 88.19%
Download in progress: 88.21%
Download in progress: 88.23%
Download in progress: 88.25%
Download in progress: 88.26%
Download in progress: 88.28%
Download in progress: 88.30%
Download in progress: 88.32%
Download in progress: 88.33%
Download in progress: 88.35%
Download in progress: 88.37%
Download in progress: 88.39%
Download in progress: 88.40%
Download in progress: 88.42%
Download in progress: 88.44%
Download in progress: 88.46%
Download in progress: 88.47%
Download in progress: 88.49%
Download in progress: 88.51%
Download in progress: 88.53%
Download in progress: 88.54%
Download in progress: 88.56%
Download in progress: 88.58%
Download in progress: 88.60%
Download in progress: 88.61%
Download in progress: 88.63%
Download in progress: 88.65%
Download in progress: 88.67%
Download in progress: 88.68%
Download in progress: 88.70%
Download in progress: 88.72%
Download in progress: 88.74%
Download in progress: 88.75%
Download in progress: 88.77%
Download in progress: 88.79%
Download in progress: 88.81%
Download in progress: 88.82%
Download in progress: 88.84%
Download in progress: 88.86%
Download in progress: 88.88%
Download in progress: 88.89%
Download in progress: 88.91%
Download in progress: 88.93%
Download in progress: 88.95%
Download in progress: 88.96%
Download in progress: 88.98%
Download in progress: 89.00%
Download in progress: 89.02%
Download in progress: 89.03%
Download in progress: 89.05%
Download in progress: 89.07%
Download in progress: 89.09%
Download in progress: 89.10%
Download in progress: 89.12%
Download in progress: 89.14%
Download in progress: 89.16%
Download in progress: 89.17%
Download in progress: 89.19%
Download in progress: 89.21%
Download in progress: 89.23%
Download in progress: 89.24%
Download in progress: 89.26%
Download in progress: 89.28%
Download in progress: 89.30%
Download in progress: 89.31%
Download in progress: 89.33%
Download in progress: 89.35%
Download in progress: 89.37%
Download in progress: 89.38%
Download in progress: 89.40%
Download in progress: 89.42%
Download in progress: 89.44%
Download in progress: 89.45%
Download in progress: 89.47%
Download in progress: 89.49%
Download in progress: 89.51%
Download in progress: 89.52%
Download in progress: 89.54%
Download in progress: 89.56%
Download in progress: 89.58%
Download in progress: 89.59%
Download in progress: 89.61%
Download in progress: 89.63%
Download in progress: 89.65%
Download in progress: 89.66%
Download in progress: 89.68%
Download in progress: 89.70%
Download in progress: 89.72%
Download in progress: 89.73%
Download in progress: 89.75%
Download in progress: 89.77%
Download in progress: 89.79%
Download in progress: 89.80%
Download in progress: 89.82%
Download in progress: 89.84%
Download in progress: 89.86%
Download in progress: 89.87%
Download in progress: 89.89%
Download in progress: 89.91%
Download in progress: 89.92%
Download in progress: 89.94%
Download in progress: 89.96%
Download in progress: 89.98%
Download in progress: 89.99%
Download in progress: 90.01%
Download in progress: 90.03%
Download in progress: 90.05%
Download in progress: 90.06%
Download in progress: 90.08%
Download in progress: 90.10%
Download in progress: 90.12%
Download in progress: 90.13%
Download in progress: 90.15%
Download in progress: 90.17%
Download in progress: 90.19%
Download in progress: 90.20%
Download in progress: 90.22%
Download in progress: 90.24%
Download in progress: 90.26%
Download in progress: 90.27%
Download in progress: 90.29%
Download in progress: 90.31%
Download in progress: 90.33%
Download in progress: 90.34%
Download in progress: 90.36%
Download in progress: 90.38%
Download in progress: 90.40%
Download in progress: 90.41%
Download in progress: 90.43%
Download in progress: 90.45%
Download in progress: 90.47%
Download in progress: 90.48%
Download in progress: 90.50%
Download in progress: 90.52%
Download in progress: 90.54%
Download in progress: 90.55%
Download in progress: 90.57%
Download in progress: 90.59%
Download in progress: 90.61%
Download in progress: 90.62%
Download in progress: 90.64%
Download in progress: 90.66%
Download in progress: 90.68%
Download in progress: 90.69%
Download in progress: 90.71%
Download in progress: 90.73%
Download in progress: 90.75%
Download in progress: 90.76%
Download in progress: 90.78%
Download in progress: 90.80%
Download in progress: 90.82%
Download in progress: 90.83%
Download in progress: 90.85%
Download in progress: 90.87%
Download in progress: 90.89%
Download in progress: 90.90%
Download in progress: 90.92%
Download in progress: 90.94%
Download in progress: 90.96%
Download in progress: 90.97%
Download in progress: 90.99%
Download in progress: 91.01%
Download in progress: 91.03%
Download in progress: 91.04%
Download in progress: 91.06%
Download in progress: 91.08%
Download in progress: 91.10%
Download in progress: 91.11%
Download in progress: 91.13%
Download in progress: 91.15%
Download in progress: 91.17%
Download in progress: 91.18%
Download in progress: 91.20%
Download in progress: 91.22%
Download in progress: 91.24%
Download in progress: 91.25%
Download in progress: 91.27%
Download in progress: 91.29%
Download in progress: 91.31%
Download in progress: 91.32%
Download in progress: 91.34%
Download in progress: 91.36%
Download in progress: 91.38%
Download in progress: 91.39%
Download in progress: 91.41%
Download in progress: 91.43%
Download in progress: 91.45%
Download in progress: 91.46%
Download in progress: 91.48%
Download in progress: 91.50%
Download in progress: 91.52%
Download in progress: 91.53%
Download in progress: 91.55%
Download in progress: 91.57%
Download in progress: 91.59%
Download in progress: 91.60%
Download in progress: 91.62%
Download in progress: 91.64%
Download in progress: 91.66%
Download in progress: 91.67%
Download in progress: 91.69%
Download in progress: 91.71%
Download in progress: 91.73%
Download in progress: 91.74%
Download in progress: 91.76%
Download in progress: 91.78%
Download in progress: 91.80%
Download in progress: 91.81%
Download in progress: 91.83%
Download in progress: 91.85%
Download in progress: 91.87%
Download in progress: 91.88%
Download in progress: 91.90%
Download in progress: 91.92%
Download in progress: 91.94%
Download in progress: 91.95%
Download in progress: 91.97%
Download in progress: 91.99%
Download in progress: 92.01%
Download in progress: 92.02%
Download in progress: 92.04%
Download in progress: 92.06%
Download in progress: 92.08%
Download in progress: 92.09%
Download in progress: 92.11%
Download in progress: 92.13%
Download in progress: 92.15%
Download in progress: 92.16%
Download in progress: 92.18%
Download in progress: 92.20%
Download in progress: 92.22%
Download in progress: 92.23%
Download in progress: 92.25%
Download in progress: 92.27%
Download in progress: 92.28%
Download in progress: 92.30%
Download in progress: 92.32%
Download in progress: 92.34%
Download in progress: 92.35%
Download in progress: 92.37%
Download in progress: 92.39%
Download in progress: 92.41%
Download in progress: 92.42%
Download in progress: 92.44%
Download in progress: 92.46%
Download in progress: 92.48%
Download in progress: 92.49%
Download in progress: 92.51%
Download in progress: 92.53%
Download in progress: 92.55%
Download in progress: 92.56%
Download in progress: 92.58%
Download in progress: 92.60%
Download in progress: 92.62%
Download in progress: 92.63%
Download in progress: 92.65%
Download in progress: 92.67%
Download in progress: 92.69%
Download in progress: 92.70%
Download in progress: 92.72%
Download in progress: 92.74%
Download in progress: 92.76%
Download in progress: 92.77%
Download in progress: 92.79%
Download in progress: 92.81%
Download in progress: 92.83%
Download in progress: 92.84%
Download in progress: 92.86%
Download in progress: 92.88%
Download in progress: 92.90%
Download in progress: 92.91%
Download in progress: 92.93%
Download in progress: 92.95%
Download in progress: 92.97%
Download in progress: 92.98%
Download in progress: 93.00%
Download in progress: 93.02%
Download in progress: 93.04%
Download in progress: 93.05%
Download in progress: 93.07%
Download in progress: 93.09%
Download in progress: 93.11%
Download in progress: 93.12%
Download in progress: 93.14%
Download in progress: 93.16%
Download in progress: 93.18%
Download in progress: 93.19%
Download in progress: 93.21%
Download in progress: 93.23%
Download in progress: 93.25%
Download in progress: 93.26%
Download in progress: 93.28%
Download in progress: 93.30%
Download in progress: 93.32%
Download in progress: 93.33%
Download in progress: 93.35%
Download in progress: 93.37%
Download in progress: 93.39%
Download in progress: 93.40%
Download in progress: 93.42%
Download in progress: 93.44%
Download in progress: 93.46%
Download in progress: 93.47%
Download in progress: 93.49%
Download in progress: 93.51%
Download in progress: 93.53%
Download in progress: 93.54%
Download in progress: 93.56%
Download in progress: 93.58%
Download in progress: 93.60%
Download in progress: 93.61%
Download in progress: 93.63%
Download in progress: 93.65%
Download in progress: 93.67%
Download in progress: 93.68%
Download in progress: 93.70%
Download in progress: 93.72%
Download in progress: 93.74%
Download in progress: 93.75%
Download in progress: 93.77%
Download in progress: 93.79%
Download in progress: 93.81%
Download in progress: 93.82%
Download in progress: 93.84%
Download in progress: 93.86%
Download in progress: 93.88%
Download in progress: 93.89%
Download in progress: 93.91%
Download in progress: 93.93%
Download in progress: 93.95%
Download in progress: 93.96%
Download in progress: 93.98%
Download in progress: 94.00%
Download in progress: 94.02%
Download in progress: 94.03%
Download in progress: 94.05%
Download in progress: 94.07%
Download in progress: 94.09%
Download in progress: 94.10%
Download in progress: 94.12%
Download in progress: 94.14%
Download in progress: 94.16%
Download in progress: 94.17%
Download in progress: 94.19%
Download in progress: 94.21%
Download in progress: 94.23%
Download in progress: 94.24%
Download in progress: 94.26%
Download in progress: 94.28%
Download in progress: 94.30%
Download in progress: 94.31%
Download in progress: 94.33%
Download in progress: 94.35%
Download in progress: 94.37%
Download in progress: 94.38%
Download in progress: 94.40%
Download in progress: 94.42%
Download in progress: 94.44%
Download in progress: 94.45%
Download in progress: 94.47%
Download in progress: 94.49%
Download in progress: 94.51%
Download in progress: 94.52%
Download in progress: 94.54%
Download in progress: 94.56%
Download in progress: 94.58%
Download in progress: 94.59%
Download in progress: 94.61%
Download in progress: 94.63%
Download in progress: 94.65%
Download in progress: 94.66%
Download in progress: 94.68%
Download in progress: 94.70%
Download in progress: 94.71%
Download in progress: 94.73%
Download in progress: 94.75%
Download in progress: 94.77%
Download in progress: 94.78%
Download in progress: 94.80%
Download in progress: 94.82%
Download in progress: 94.84%
Download in progress: 94.85%
Download in progress: 94.87%
Download in progress: 94.89%
Download in progress: 94.91%
Download in progress: 94.92%
Download in progress: 94.94%
Download in progress: 94.96%
Download in progress: 94.98%
Download in progress: 94.99%
Download in progress: 95.01%
Download in progress: 95.03%
Download in progress: 95.05%
Download in progress: 95.06%
Download in progress: 95.08%
Download in progress: 95.10%
Download in progress: 95.12%
Download in progress: 95.13%
Download in progress: 95.15%
Download in progress: 95.17%
Download in progress: 95.19%
Download in progress: 95.20%
Download in progress: 95.22%
Download in progress: 95.24%
Download in progress: 95.26%
Download in progress: 95.27%
Download in progress: 95.29%
Download in progress: 95.31%
Download in progress: 95.33%
Download in progress: 95.34%
Download in progress: 95.36%
Download in progress: 95.38%
Download in progress: 95.40%
Download in progress: 95.41%
Download in progress: 95.43%
Download in progress: 95.45%
Download in progress: 95.47%
Download in progress: 95.48%
Download in progress: 95.50%
Download in progress: 95.52%
Download in progress: 95.54%
Download in progress: 95.55%
Download in progress: 95.57%
Download in progress: 95.59%
Download in progress: 95.61%
Download in progress: 95.62%
Download in progress: 95.64%
Download in progress: 95.66%
Download in progress: 95.68%
Download in progress: 95.69%
Download in progress: 95.71%
Download in progress: 95.73%
Download in progress: 95.75%
Download in progress: 95.76%
Download in progress: 95.78%
Download in progress: 95.80%
Download in progress: 95.82%
Download in progress: 95.83%
Download in progress: 95.85%
Download in progress: 95.87%
Download in progress: 95.89%
Download in progress: 95.90%
Download in progress: 95.92%
Download in progress: 95.94%
Download in progress: 95.96%
Download in progress: 95.97%
Download in progress: 95.99%
Download in progress: 96.01%
Download in progress: 96.03%
Download in progress: 96.04%
Download in progress: 96.06%
Download in progress: 96.08%
Download in progress: 96.10%
Download in progress: 96.11%
Download in progress: 96.13%
Download in progress: 96.15%
Download in progress: 96.17%
Download in progress: 96.18%
Download in progress: 96.20%
Download in progress: 96.22%
Download in progress: 96.24%
Download in progress: 96.25%
Download in progress: 96.27%
Download in progress: 96.29%
Download in progress: 96.31%
Download in progress: 96.32%
Download in progress: 96.34%
Download in progress: 96.36%
Download in progress: 96.38%
Download in progress: 96.39%
Download in progress: 96.41%
Download in progress: 96.43%
Download in progress: 96.45%
Download in progress: 96.46%
Download in progress: 96.48%
Download in progress: 96.50%
Download in progress: 96.52%
Download in progress: 96.53%
Download in progress: 96.55%
Download in progress: 96.57%
Download in progress: 96.59%
Download in progress: 96.60%
Download in progress: 96.62%
Download in progress: 96.64%
Download in progress: 96.66%
Download in progress: 96.67%
Download in progress: 96.69%
Download in progress: 96.71%
Download in progress: 96.73%
Download in progress: 96.74%
Download in progress: 96.76%
Download in progress: 96.78%
Download in progress: 96.80%
Download in progress: 96.81%
Download in progress: 96.83%
Download in progress: 96.85%
Download in progress: 96.87%
Download in progress: 96.88%
Download in progress: 96.90%
Download in progress: 96.92%
Download in progress: 96.94%
Download in progress: 96.95%
Download in progress: 96.97%
Download in progress: 96.99%
Download in progress: 97.01%
Download in progress: 97.02%
Download in progress: 97.04%
Download in progress: 97.06%
Download in progress: 97.07%
Download in progress: 97.09%
Download in progress: 97.11%
Download in progress: 97.13%
Download in progress: 97.14%
Download in progress: 97.16%
Download in progress: 97.18%
Download in progress: 97.20%
Download in progress: 97.21%
Download in progress: 97.23%
Download in progress: 97.25%
Download in progress: 97.27%
Download in progress: 97.28%
Download in progress: 97.30%
Download in progress: 97.32%
Download in progress: 97.34%
Download in progress: 97.35%
Download in progress: 97.37%
Download in progress: 97.39%
Download in progress: 97.41%
Download in progress: 97.42%
Download in progress: 97.44%
Download in progress: 97.46%
Download in progress: 97.48%
Download in progress: 97.49%
Download in progress: 97.51%
Download in progress: 97.53%
Download in progress: 97.55%
Download in progress: 97.56%
Download in progress: 97.58%
Download in progress: 97.60%
Download in progress: 97.62%
Download in progress: 97.63%
Download in progress: 97.65%
Download in progress: 97.67%
Download in progress: 97.69%
Download in progress: 97.70%
Download in progress: 97.72%
Download in progress: 97.74%
Download in progress: 97.76%
Download in progress: 97.77%
Download in progress: 97.79%
Download in progress: 97.81%
Download in progress: 97.83%
Download in progress: 97.84%
Download in progress: 97.86%
Download in progress: 97.88%
Download in progress: 97.90%
Download in progress: 97.91%
Download in progress: 97.93%
Download in progress: 97.95%
Download in progress: 97.97%
Download in progress: 97.98%
Download in progress: 98.00%
Download in progress: 98.02%
Download in progress: 98.04%
Download in progress: 98.05%
Download in progress: 98.07%
Download in progress: 98.09%
Download in progress: 98.11%
Download in progress: 98.12%
Download in progress: 98.14%
Download in progress: 98.16%
Download in progress: 98.18%
Download in progress: 98.19%
Download in progress: 98.21%
Download in progress: 98.23%
Download in progress: 98.25%
Download in progress: 98.26%
Download in progress: 98.28%
Download in progress: 98.30%
Download in progress: 98.32%
Download in progress: 98.33%
Download in progress: 98.35%
Download in progress: 98.37%
Download in progress: 98.39%
Download in progress: 98.40%
Download in progress: 98.42%
Download in progress: 98.44%
Download in progress: 98.46%
Download in progress: 98.47%
Download in progress: 98.49%
Download in progress: 98.51%
Download in progress: 98.53%
Download in progress: 98.54%
Download in progress: 98.56%
Download in progress: 98.58%
Download in progress: 98.60%
Download in progress: 98.61%
Download in progress: 98.63%
Download in progress: 98.65%
Download in progress: 98.67%
Download in progress: 98.68%
Download in progress: 98.70%
Download in progress: 98.72%
Download in progress: 98.74%
Download in progress: 98.75%
Download in progress: 98.77%
Download in progress: 98.79%
Download in progress: 98.81%
Download in progress: 98.82%
Download in progress: 98.84%
Download in progress: 98.86%
Download in progress: 98.88%
Download in progress: 98.89%
Download in progress: 98.91%
Download in progress: 98.93%
Download in progress: 98.95%
Download in progress: 98.96%
Download in progress: 98.98%
Download in progress: 99.00%
Download in progress: 99.02%
Download in progress: 99.03%
Download in progress: 99.05%
Download in progress: 99.07%
Download in progress: 99.09%
Download in progress: 99.10%
Download in progress: 99.12%
Download in progress: 99.14%
Download in progress: 99.16%
Download in progress: 99.17%
Download in progress: 99.19%
Download in progress: 99.21%
Download in progress: 99.23%
Download in progress: 99.24%
Download in progress: 99.26%
Download in progress: 99.28%
Download in progress: 99.30%
Download in progress: 99.31%
Download in progress: 99.33%
Download in progress: 99.35%
Download in progress: 99.37%
Download in progress: 99.38%
Download in progress: 99.40%
Download in progress: 99.42%
Download in progress: 99.43%
Download in progress: 99.45%
Download in progress: 99.47%
Download in progress: 99.49%
Download in progress: 99.50%
Download in progress: 99.52%
Download in progress: 99.54%
Download in progress: 99.56%
Download in progress: 99.57%
Download in progress: 99.59%
Download in progress: 99.61%
Download in progress: 99.63%
Download in progress: 99.64%
Download in progress: 99.66%
Download in progress: 99.68%
Download in progress: 99.70%
Download in progress: 99.71%
Download in progress: 99.73%
Download in progress: 99.75%
Download in progress: 99.77%
Download in progress: 99.78%
Download in progress: 99.80%
Download in progress: 99.82%
Download in progress: 99.84%
Download in progress: 99.85%
Download in progress: 99.87%
Download in progress: 99.89%
Download in progress: 99.91%
Download in progress: 99.92%
Download in progress: 99.94%
Download in progress: 99.96%
Download in progress: 99.98%
Download in progress: 99.99%
Download in progress: 100.01%
Loading test db for resolution 16 with 10 samples
Loading test db for resolution 32 with 10 samples
Visualizing the data
Let’s examine the shape and structure of our dataset at different resolutions.
for res, test_loader in test_loaders.items():
    print(f"Resolution: {res}")
    # Get first batch
    batch = next(iter(test_loader))
    x = batch["x"]  # Input
    y = batch["y"]  # Output

    print(f"Testing samples for resolution {res} have shape {x.shape[1:]}")


data = train_dataset[0]
x = data["x"]
y = data["y"]

print(f"Training samples have shape {x.shape[1:]}")

# Which sample to view
index = 0

data = train_dataset[index]
data = data_processor.preprocess(data, batched=False)

# The first step of the default FNO model is a grid-based
# positional embedding. We will add it manually here to
# visualize the channels appended by this embedding.
positional_embedding = GridEmbedding2D(in_channels=1)
# At train time, data will be collated with a batch dimension.
# We create a batch dimension to pass into the embedding, then re-squeeze
x = positional_embedding(data["x"].unsqueeze(0)).squeeze(0)
y = data["y"]
Resolution: 16
/opt/hostedtoolcache/Python/3.13.14/x64/lib/python3.13/site-packages/torch/utils/data/dataloader.py:1095: UserWarning: 'pin_memory' argument is set as true but no accelerator is found, then device pinned memory won't be used.
  super().__init__(loader)
Testing samples for resolution 16 have shape torch.Size([1, 16, 16])
Resolution: 32
Testing samples for resolution 32 have shape torch.Size([1, 32, 32])
Training samples have shape torch.Size([16, 16])
Visualizing the processed data
We can see how the positional embedding adds coordinate information to our input data. This helps the neural operator understand spatial relationships in the data.
fig = plt.figure(figsize=(7, 7))
ax = fig.add_subplot(2, 2, 1)
ax.imshow(x[0], cmap="gray")
ax.set_title("Input x")
ax = fig.add_subplot(2, 2, 2)
ax.imshow(y.squeeze())
ax.set_title("Output y")
ax = fig.add_subplot(2, 2, 3)
ax.imshow(x[1])
ax.set_title("Positional embedding: x-coordinates")
ax = fig.add_subplot(2, 2, 4)
ax.imshow(x[2])
ax.set_title("Positional embedding: y-coordinates")
fig.suptitle("Visualizing one input sample with positional embeddings", y=0.98)
plt.tight_layout()
fig.show()
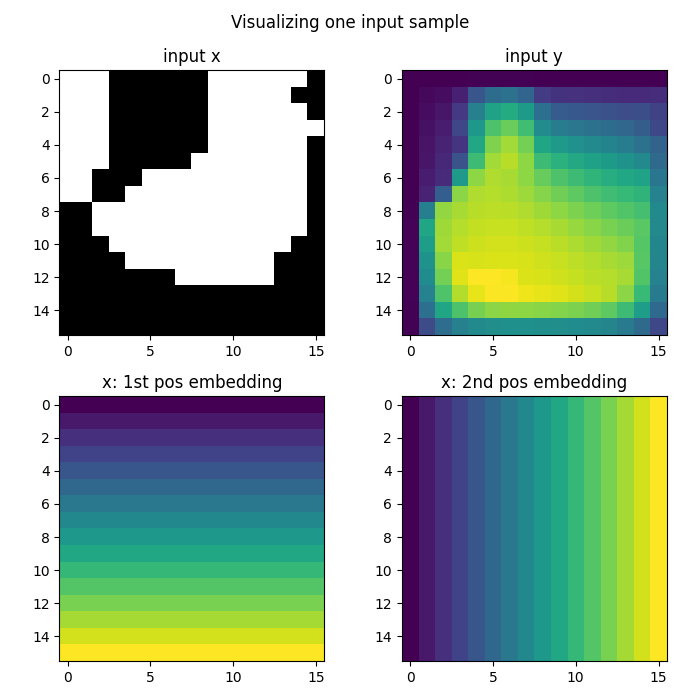
Total running time of the script: (0 minutes 47.238 seconds)